TPLPTPLP is gaining momentum now, it has not performed in previous rallies so it might be risky trade also the trend in not confirmed yet. If sustained 12.2 then it can give fantastic returns.
−6.76 PKR
−4.02 B PKR
907.94 M PKR
161.11 M
About TPL PROPERTIES LTD
Sector
Industry
CEO
Muhammad Ali Jameel
Website
Headquarters
Karachi
Founded
2007
ISIN
PK0110601017
FIGI
BBG00D34SQX5
TPL Properties Ltd. is a holding company, which engages in real estate development. Its activities include investing, purchasing, developing, selling, leasing, and disposing of real estate primarily in the commercial and residential asset classes. The company was founded on February 14, 2007 and is headquartered in Karachi, Pakistan.
Related stocks

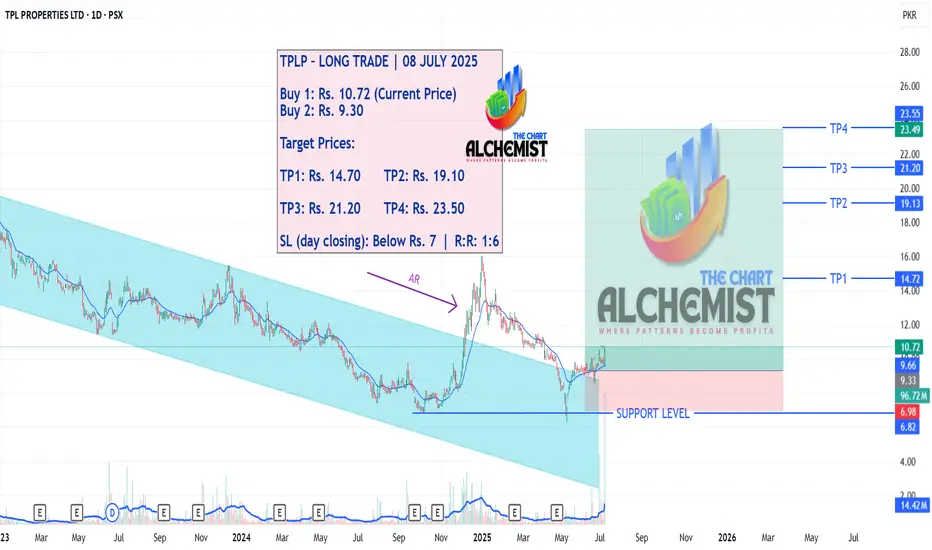
TPLP – LONG TRADE | 08 JULY 2025TPLP – LONG TRADE | 08 JULY 2025
TPLP broke out of a downward channel in December, followed by an automatic rally and a retest of the original support zone with a spring. Current structure indicates signs of a strong upward reversal, with multiple quantified targets likely to be achieved in the next
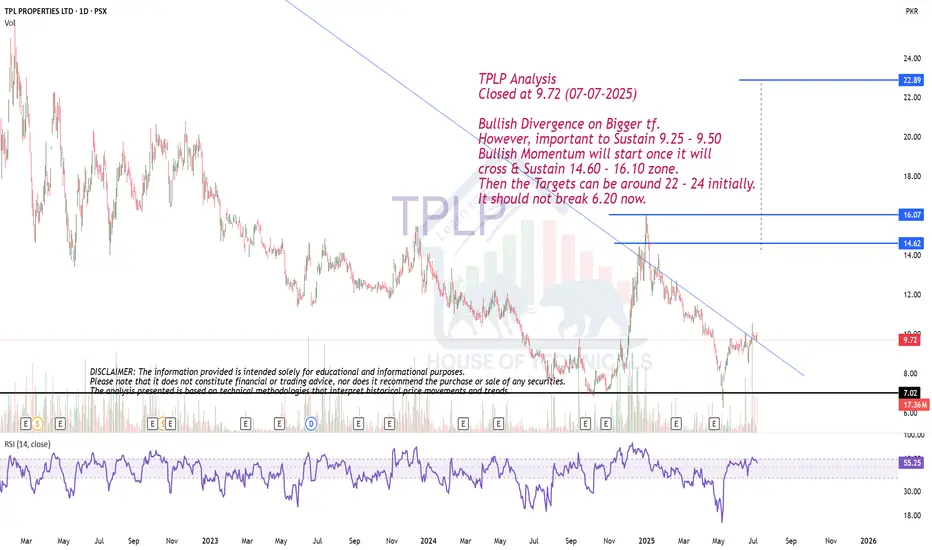
Bullish Divergence on Bigger tf.TPLP Analysis
Closed at 9.72 (07-07-2025)
Bullish Divergence on Bigger tf.
However, important to Sustain 9.25 - 9.50
Bullish Momentum will start once it will
cross & Sustain 14.60 - 16.10 zone.
Then the Targets can be around 22 - 24 initially.
It should not break 6.20 now.
TPLP Technical Analysis(Weekly): Potential Bullish SetupTPLP (TPL Properties Ltd) has recently bounced from a monthly support level, accompanied by a strong bullish closing on the weekly chart, indicating a good discount level for potential buyers. The price also took support from a downward trendline on the weekly timeframe. While we may or may not rete

TPLP montly Bull Flag BOTPLP Bull Flag Pattern BO with target 45.51 (100%) and 50% Target 28.52.
There is very strong resistance at 20.55
But first it have to BO the resistance of 15.97.
Its current price is around 200 SMA
This is not a trade call but just an educational purpose

Bullish Divergence on Weekly TF.Bullish Divergence on Weekly TF.
Seems like taking Support from a Very Important
fib. level around 10.30 - 11.40
Falling Wedge Pattern on Daily TF.
10.90 Should be Sustained on Monthly Basis, otherwise
we may witness further Selling pressure till 8.
Important Resistance is around 12.30 - 12.65 as of

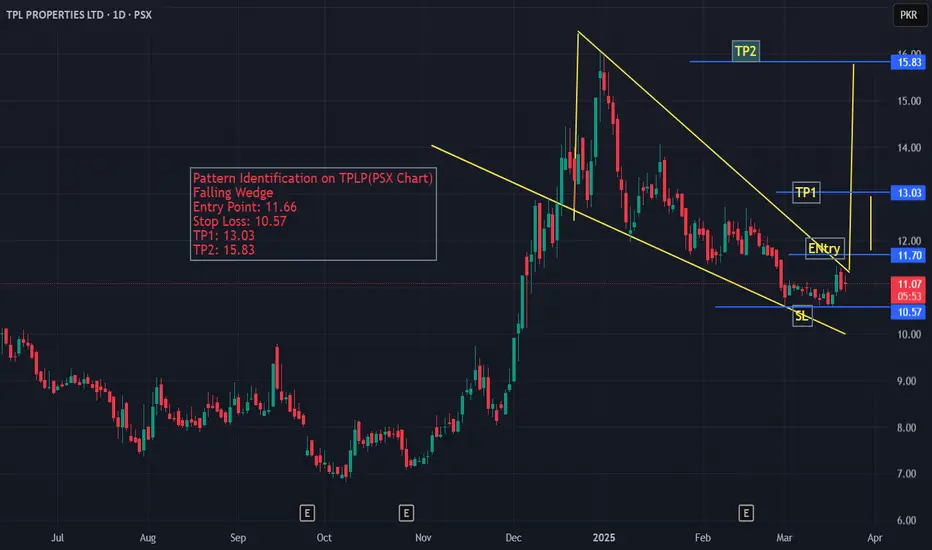
Chart Identification on TPLP(PSX) Daily ChartThe Chart of TPLP shows a pattern of Falling Wedge, The projections for this stock and the entry point, stop loss and TP1 and TP2 are mentioned on the chart for traders and ivestors.
Bullish on All Time Frames.
Bullish Divergence on Monthly Basis.
Falling Wedge Pattern on Weekly TF.
Crossing & Sustaining 14.70 may lead it
towards 18.30 - 19.50 initially.
11 is an Important Level that should not
be broken.

TPLP Buy Trade PlanTPLP is trading in a bullish penant and has taken support on key fib levels. TPs are 15.45 and below 17

See all ideas
Summarizing what the indicators are suggesting.
Oscillators
Neutral
SellBuy
Strong sellStrong buy
Strong sellSellNeutralBuyStrong buy
Oscillators
Neutral
SellBuy
Strong sellStrong buy
Strong sellSellNeutralBuyStrong buy
Summary
Neutral
SellBuy
Strong sellStrong buy
Strong sellSellNeutralBuyStrong buy
Summary
Neutral
SellBuy
Strong sellStrong buy
Strong sellSellNeutralBuyStrong buy
Summary
Neutral
SellBuy
Strong sellStrong buy
Strong sellSellNeutralBuyStrong buy
Moving Averages
Neutral
SellBuy
Strong sellStrong buy
Strong sellSellNeutralBuyStrong buy
Moving Averages
Neutral
SellBuy
Strong sellStrong buy
Strong sellSellNeutralBuyStrong buy
Displays a symbol's price movements over previous years to identify recurring trends.
Frequently Asked Questions
The current price of TPLP is 9.56 PKR — it has decreased by −1.65% in the past 24 hours. Watch TPL PROPERTIES LTD stock price performance more closely on the chart.
Depending on the exchange, the stock ticker may vary. For instance, on PSX exchange TPL PROPERTIES LTD stocks are traded under the ticker TPLP.
TPLP stock has fallen by −5.53% compared to the previous week, the month change is a 2.14% rise, over the last year TPL PROPERTIES LTD has showed a 12.47% increase.
TPLP reached its all-time high on Sep 20, 2021 with the price of 40.36 PKR, and its all-time low was 1.86 PKR and was reached on Mar 25, 2020. View more price dynamics on TPLP chart.
See other stocks reaching their highest and lowest prices.
See other stocks reaching their highest and lowest prices.
TPLP stock is 2.94% volatile and has beta coefficient of 1.78. Track TPL PROPERTIES LTD stock price on the chart and check out the list of the most volatile stocks — is TPL PROPERTIES LTD there?
Today TPL PROPERTIES LTD has the market capitalization of 5.36 B, it has decreased by −0.77% over the last week.
Yes, you can track TPL PROPERTIES LTD financials in yearly and quarterly reports right on TradingView.
TPLP net income for the last quarter is −1.47 B PKR, while the quarter before that showed 542.30 M PKR of net income which accounts for −370.65% change. Track more TPL PROPERTIES LTD financial stats to get the full picture.
As of Jul 27, 2025, the company has 21 employees. See our rating of the largest employees — is TPL PROPERTIES LTD on this list?
EBITDA measures a company's operating performance, its growth signifies an improvement in the efficiency of a company. TPL PROPERTIES LTD EBITDA is −814.07 M PKR, and current EBITDA margin is −51.37%. See more stats in TPL PROPERTIES LTD financial statements.
Like other stocks, TPLP shares are traded on stock exchanges, e.g. Nasdaq, Nyse, Euronext, and the easiest way to buy them is through an online stock broker. To do this, you need to open an account and follow a broker's procedures, then start trading. You can trade TPL PROPERTIES LTD stock right from TradingView charts — choose your broker and connect to your account.
Investing in stocks requires a comprehensive research: you should carefully study all the available data, e.g. company's financials, related news, and its technical analysis. So TPL PROPERTIES LTD technincal analysis shows the strong sell today, and its 1 week rating is strong sell. Since market conditions are prone to changes, it's worth looking a bit further into the future — according to the 1 month rating TPL PROPERTIES LTD stock shows the sell signal. See more of TPL PROPERTIES LTD technicals for a more comprehensive analysis.
If you're still not sure, try looking for inspiration in our curated watchlists.
If you're still not sure, try looking for inspiration in our curated watchlists.