TPLPTPLP is gaining momentum now, it has not performed in previous rallies so it might be risky trade also the trend in not confirmed yet. If sustained 12.2 then it can give fantastic returns.
TPLP trade ideas

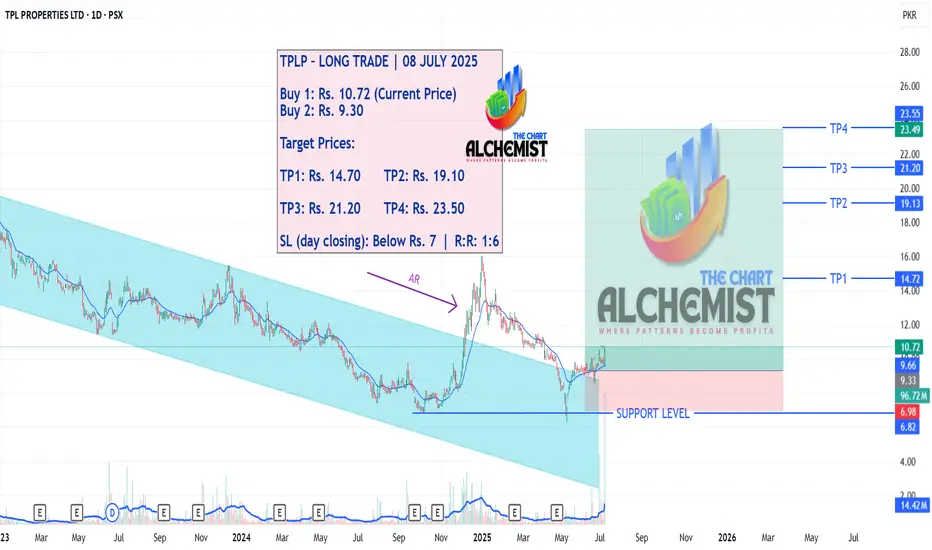
TPLP – LONG TRADE | 08 JULY 2025TPLP – LONG TRADE | 08 JULY 2025
TPLP broke out of a downward channel in December, followed by an automatic rally and a retest of the original support zone with a spring. Current structure indicates signs of a strong upward reversal, with multiple quantified targets likely to be achieved in the next leg of the trend.
📌 Execution Strategy:
Caution: Please buy in 3 parts within the buying range. Close at least 50% of your position at TP1 and trail the stop loss to protect profits in case of unforeseen market conditions.
📢 Disclaimer: Do not copy or redistribute signals without prior consent or proper credit to The Chart Alchemist (TCA).
✨ Kindly support our efforts by boosting and sharing this idea!
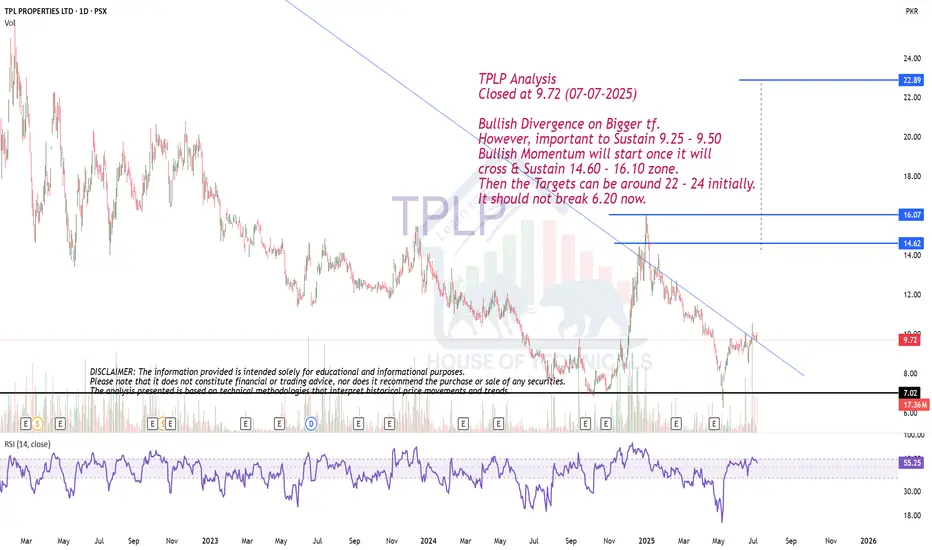
Bullish Divergence on Bigger tf.TPLP Analysis
Closed at 9.72 (07-07-2025)
Bullish Divergence on Bigger tf.
However, important to Sustain 9.25 - 9.50
Bullish Momentum will start once it will
cross & Sustain 14.60 - 16.10 zone.
Then the Targets can be around 22 - 24 initially.
It should not break 6.20 now.
TPLP Technical Analysis(Weekly): Potential Bullish SetupTPLP (TPL Properties Ltd) has recently bounced from a monthly support level, accompanied by a strong bullish closing on the weekly chart, indicating a good discount level for potential buyers. The price also took support from a downward trendline on the weekly timeframe. While we may or may not retest the Buy 2 level, there is a probability as it aligns with a daily gap-up level that price might look to fill. After Take Profit 2, there isn't significant major resistance, suggesting the potential for the price to reach Take Profit 3. It's truly a game of probabilities, and the odds here look compelling for upside!
Trading Recommendations:
Buy 1 (CMP): 9.14
Buy 2: 7.3
Stop-Loss Level: Closing below 6
Take Profit 1: 14.7
Take Profit 2: 20
Take Profit 3: 38.5
Happy trading!

TPLP montly Bull Flag BOTPLP Bull Flag Pattern BO with target 45.51 (100%) and 50% Target 28.52.
There is very strong resistance at 20.55
But first it have to BO the resistance of 15.97.
Its current price is around 200 SMA
This is not a trade call but just an educational purpose

Bullish Divergence on Weekly TF.Bullish Divergence on Weekly TF.
Seems like taking Support from a Very Important
fib. level around 10.30 - 11.40
Falling Wedge Pattern on Daily TF.
10.90 Should be Sustained on Monthly Basis, otherwise
we may witness further Selling pressure till 8.
Important Resistance is around 12.30 - 12.65 as of now.

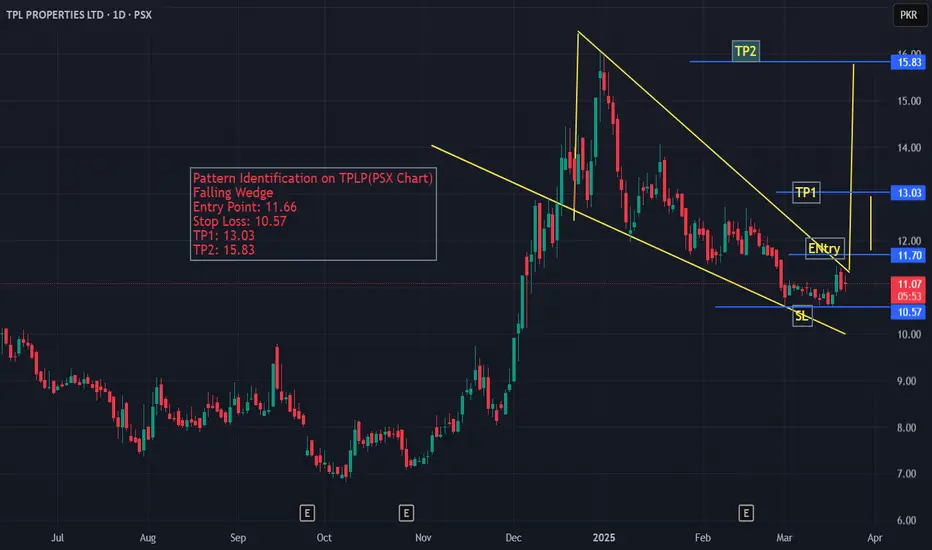
Chart Identification on TPLP(PSX) Daily ChartThe Chart of TPLP shows a pattern of Falling Wedge, The projections for this stock and the entry point, stop loss and TP1 and TP2 are mentioned on the chart for traders and ivestors.
Bullish on All Time Frames.
Bullish Divergence on Monthly Basis.
Falling Wedge Pattern on Weekly TF.
Crossing & Sustaining 14.70 may lead it
towards 18.30 - 19.50 initially.
11 is an Important Level that should not
be broken.

TPLP Buy Trade PlanTPLP is trading in a bullish penant and has taken support on key fib levels. TPs are 15.45 and below 17

Bullish on All Time Frames.Bullish on All Time Frames.
Weekly Bullish Divergence playing well.
Potential to touch 17 & then 19 - 19.50
However, little Resistance is around 15.50
Good Support is around 12.80 - 13.50

Uptrend in TPLPThere is a clear uptrend in TPLP and no divergence in the chart on the daily timeframe. The current uptrend is expected to continue following the Dow Theory and forming new HHs and HLs as per the Entry Point, Stop loss, and TPs highlighted in the chart. This can be a good point to take long positions in TPLP.

TPLP PSX Trade PlanTPLP
Divergence
Buy when trend line breaks,
Stop loss and profit levels defined.
Fundamentally a weak stock,
Technicals will play according to this trade plan

TPLP is BullishPrice was in a strong downtrend respecting the descending trendline. However, bullish divergence followed by the break of trendline hints the control of bulls. If the bulls manage to break previous lower high then a bullish reversal is on the cards as per Dow theory. Targets are mentioned on the chart.

TPLP-PakistanBreak out of trend line and accumulation phase
Bullish Divergence on RSI
Breakout and closing above last LH will give strength to Bulls
Price is expected to move up

TPLP- (PSX) - LONG Trade CallOn daily time frame price is at the bottom of trendline.
Bullish hidden divergence is also observed. Therefore LONG trade is in order.
Entry Instant Buy: 8.41
TP1: 9.20
TP2: 9.80
SL 8.20

TPLP_KSE100_#TPLP__#Trading_#daily_#call_#IdeaThe daily chart shows a strong bullish divergence, However the price making consecutive lower lows and lower closes, with this bullish divergence we are expecting the trend might reverse and Bulls may again step in and shows dominance.
The recent price action has formed a complex pullback, and now the price is testing the strong resistance zone 8.89, which is a psychological level. If the price maintain this level, I expect it the script will bounce back from this level and shows some upwards momentum. Potential levels identified on the charts as well.
# DYOR (Do your own research as well)
Traders, if you liked this idea write in the comments and give your feedback as well thanks

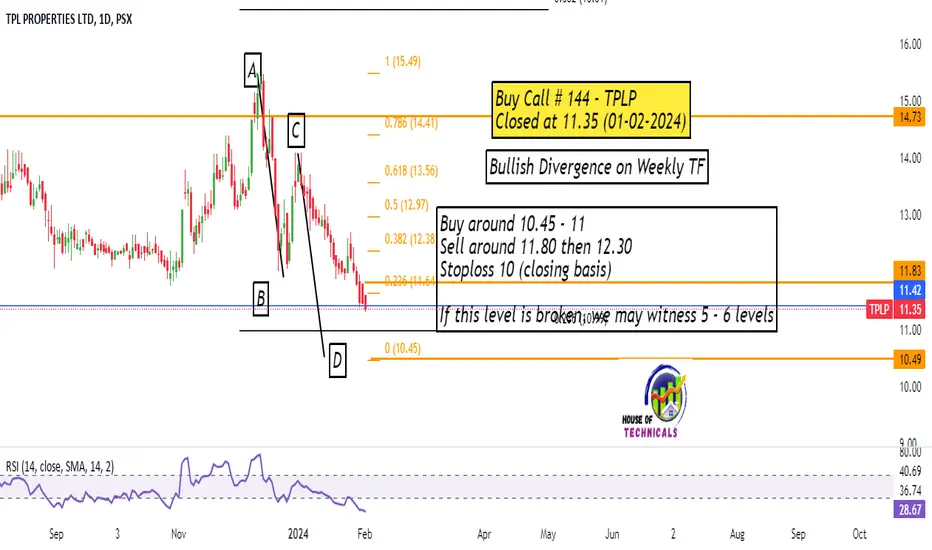
TPLP in ABCD patternTPLP is forming ABCD pattern, Trade is set considering that price will break point 'B'. No divergence is found which indicates bearish market.

TPLP is BullishA bullish divergence appeared, matured and is now playing out, previous lower high is broken and bulls seem to have to have taken control of the price action. This could potentially mark the beginning of a bullish rally. Targets are mentioned on the chart.

Bearish ABCD seems in playBuy around 10.45 - 11
Sell around 11.80 then 12.30
Stoploss 10 (closing basis)
If this level is broken, we may witness 5 - 6 levels

Breakout expectedP/E is low compared to rest of market and also low from it's competitors, it's added in few mutual fund so keep an eye on price action
