TREET – LONG TRADE (SECOND STRIKE) | 12 JULY 2025TREET – LONG TRADE (SECOND STRIKE) | 12 JULY 2025
The stock previously trended downward in a blue channel but has reversed, forming an inverted head and shoulders pattern. With multiple bullish structures in place, the current level appears to be a profitable and safe entry point.
TREET trade ideas

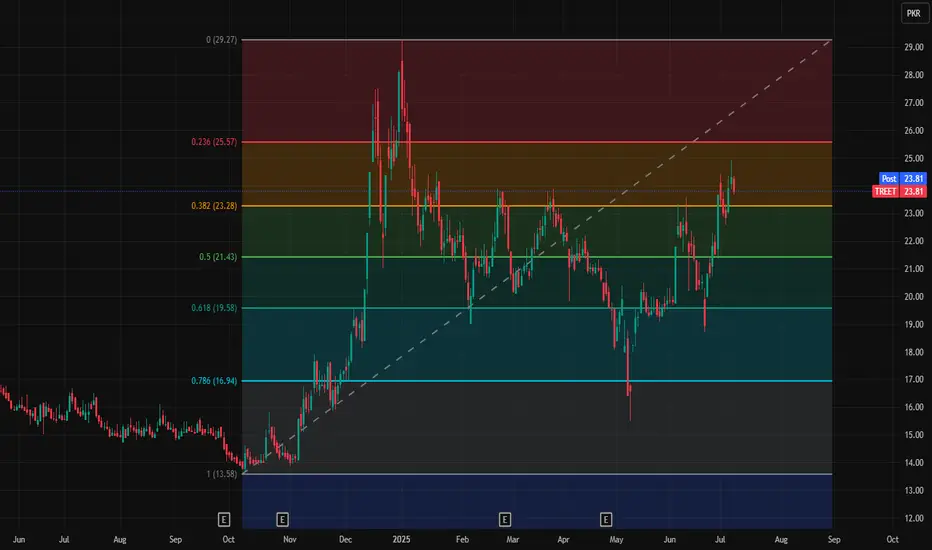
Fresh entry for TreetTreet is near its support level of 23.28 and fresh entry is possible at this level with SL 21.4 and TPs 25.57 and 29.27
Note: This is not a buy/sell trade call.
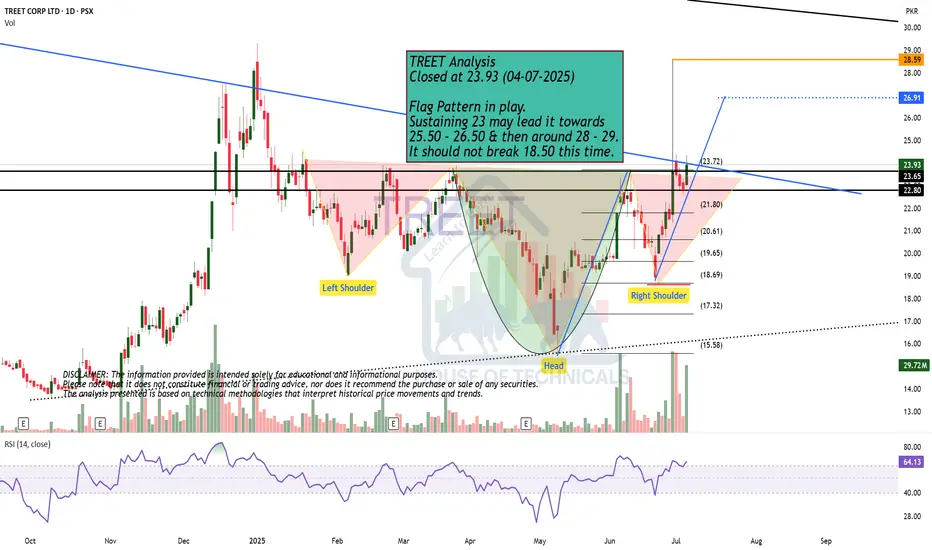
Flag Pattern in play. TREET Analysis
Closed at 23.93 (04-07-2025)
Flag Pattern in play.
Sustaining 23 may lead it towards
25.50 - 26.50 & then around 28 - 29.
It should not break 18.50 this time.
Currently at Strong Resistance level.TREET closed at 19.53 (23-05-25)
Currently at Strong Resistance level.
However, Weekly closing above 19.50 would
be a positive sign and we may see upside
around 21 - 21.30 & then 23.
Very Important Support lies around 17.50
& then around 14.50; however that would be
a very crucial level as breaking 14.50 would
trigger more selling pressure.

IF YOU MISSED BNL- DON'T SKIP TREET BREAKOUTTREET was in long-term downtrend till June 2021, it gave breakout in June and it's Pullback continued from July 21 to Dec 2022. I has been long term accumulation phases A,B,C & D of Wyckkoff Method from Dec 2022 to Dec 2024. It has given breakout from this consolidation and has given a beautiful Spring on Pullback of phase D. Huge up move after Breakout with above average volume and candle after Rs 22.2

Treet PSXPattern,
Volums,
stop-loss defined,
Assume the Corrective phase completed,
Entry on break of Lower high,

Breakout ExpectedResistance at 21.80 - 22
Crossing & Sustaining this level
will lead it towards 23 - 23.50
initially & then 24.50 - 26

Chart is a technical analysis of TREET Corp Ltd (PSX: TREET).Key Observations:
Price Action:
Current price: 22.20 PKR
Recent high: 23.27 PKR
Resistance level at 24.60 PKR
Support around 21.00 PKR
Price has broken above a trendline, signaling a potential bullish breakout.
Technical Patterns:
Head and Shoulders Formation in the middle of the chart, followed by a breakout.
Trendlines (dashed red and green) indicate a downtrend reversal.
Measured move projection suggests potential targets at 23.27 PKR and 24.60 PKR.
Momentum Indicators:
RSI (Relative Strength Index) is around 51.39, indicating neutral momentum.
Bearish Divergence seen in RSI (lower highs in RSI vs. higher highs in price), which could indicate weakening momentum.
Volume spikes suggest buying interest.
Conclusion:
The price has recently broken out of a consolidation phase and is testing resistance levels.
If TREET sustains above 22.20, it could test 23.27 and 24.60.
However, the RSI bearish divergence warns of possible exhaustion.
If the price falls below 21.00, a retest of lower supports (around 19.00) could occur.

TREET - PSX - Monthly SWING Trade Technical AnalysisOn monthly TF, Butterfly Harmonic pattern has been drawn.
Technically correct entry should be after crossing the resistance zone.
RSI is at 58 level which shows ample of room for price to go up. EMA-21 line is also below the price candles. Bollinger Band also suggest that bull run is on.
SWING Trade Value:
Buy : 23
TP-1: 47 (expected in April 2025)
TP-2: 68 (expected in Dec 2025)
SL: 13.64 (previously defined Low)

TREET - PSX - BUY Trade Call - Pole & Flag with FibTreet on Daily TF is continuously making Pole & Flag patterns.
Right now, there is a Bearish Divergence present on RSI indicating prices will drop.
By comparing previous FIB retracement, it is likely to re-trace up till Fib 0.50.
Therefore, my trade values are:-
Trade Value:
Buy : 17.92
TP: 21.68
SL: 15.70

TREET🚀 Stock Alert: TREET
📈 Investment View: Technically Bullish 📈
🔍 Quick Info:
📈 Buying Range: 15.20 - 15.30
🎯 First Target : 16.50
🎯 Second Target : 17.50
⚠ Stop Loss: 14.50
⏳ Nature of Trade: Mid Term
📉 Risk Level: Medium
☪ Shariah Compliant: YES
💰 Dividend Paying: NO
Note: Do you own analysis before taking any position and always use stop loss to manage your risk.

TREETWe can attempt to buy TREET from specified level as 0.618 FIB level intact , also there is no bearish divergence at current levels indicate that it move upward .
SL , TP mention in chart.

Treet Techanical Analysis. Treet is consolidating between its range of 15.81 to 18.50. If market is able to break the consolidation level of 15.81 to 18.50 then the nest targets are 20.40 and second target is 22.80. This is the techanical point of view of the company.

TREET - ACCUMULATION PHASETREET is in accumulation phase on daily chart, it might go upward in the coming days. if it breaks the supports then it might fall more below.

Reversal or What??Bullish Divergence appearing on Hourly TF
Touching & Sustaining the level around 15.80
may trigger the Price Upside

Bullish Divergence is witness on Monthly TFBullish Divergence is witness on Monthly TF
However, It needs to break & Sustain 19 for Further Upside
17 is the initial Hurdle for Treet to Break & Sustain on Shorter TF

TREET is BullishTREET gave a breakout from the accumulation phase, and made a new higher high, followed by a potential higher low. It is looking good for a bullish rally. Targets are mentioned on the chart.


TREETBuy1 around 17.60 - 17.80 | Sell around 19 - 20
Buy2 around 16.30 - 16.50 | Sell around 18 - 18.50
Stoploss 16 (closing basis)

TREET is BullishTREET is currently extremely bullish on daily time frame as it has defined first higher high and higher low, which is a pre-requisite for a bullish rally as per Dow theory. The trend is most likely to continue and bulls will remain in charge for coming days and weeks. Targets are mentioned on the chart.

TREET - LONGTreet - Long
Bullish Divergence on RSI
Double bottom on Weekly. Closed above Neckline
Breaking out of Weekly Accumulation
Entry: 19.73
SL: 12.16
TP 1: 30% offload @ 28.93
Risk: 4%

TREET is BullishTREET has given a breakout from the accumulation phase, and is the retest is successful it would start a bullish rally. Targets are mentioned on the chart.
