TRG – SHORT SELL / EXIT SIGNAL (FLIP TRADE) | 20 JULY 2025TRG – SHORT SELL / EXIT SIGNAL (FLIP TRADE) | 20 JULY 2025
TRG has maintained a bearish market structure, consistently printing lower highs and lower lows—confirming an established downtrend. After a short-term retracement to the 20 EMA, the stock has resumed its downward movement, suggesting that further downside is likely. This setup presents a clear opportunity for short sellers or an exit point for long holders.
TRG trade ideas

TRG FALLING WEDGE 2x... 3X...4X...?TRG ELITE KATCHRA💎
CMP: 58.76
From forgotten junk to potential multi-bagger 2x... 3X...4X...? will see what unfolds...
TRG is showing signs of a potential long-term reversal after a multi-year downtrend. Price action is compressing within a large falling wedge pattern, typically a bullish formation. A breakout above the upper trendline (~60–62) with volume could trigger a major upside move 110 - 120, with a long-term price target potentially reaching 153 - 200+.
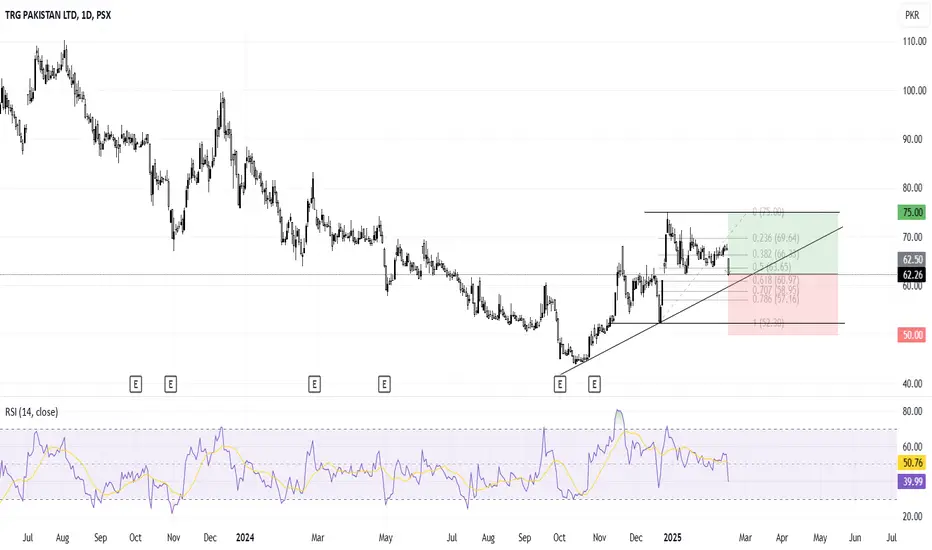
Watch closely for confirmation abv 76.00 on weekly.
This analysis is for educational and informational purposes only. It does not constitute investment advice or a recommendation to buy or sell any security. Always conduct your own research or consult with a licensed financial advisor before making investment decisions. Past performance is not indicative of future results.
#kse100 #psx #tradeflow #trg #pakistan

TRG LongTRG has made a perfect bullish harmonic pattern where it has retraced to exact 127.2% of its last top and now will move till 161.8% of its all-time high which is nearly 295. This is not a buy/sell call, its just my own analysis and you may disagree. However, I'd urge you to study bullish and bearish harmonic patterns which are not so common in Pakistani market but some international players often run a stock through this pattern. Similar patterns can be noticed in GHNI and GAL as well.

TRG LONG TRADETRG was in BULL RUN since March 2020 to April 21, it is trending in bullish channel since 2020, it has now bottomed out in this channel as seen in 1W chart at bottom.
As seen in 1D chart it has given bullish reversal on heavy volumes on upward leg and much lighter volume on downward pullback, furthermore it has successfully created an Spring or Bear Trap which is precursor to up move.
Price Action also suggests an impending uptrend since the pullback is in the form of Bear wedge which is in fact a Bull Flag that has completed its three pushes on downside. It also confirms the take off to upside
BUY TRG 56-60
TP1 69.5
TP2 82.5
SL 51.1

TRG, Buy Opportunity is coming up !Buy once price closes above BB50
Price target1: 92.59
Price Target2: 150

TRG LONGTERM ANALYSIS AND NEW ALL TIME HIGH COMINGTRG has been in Pullback since May 2021 when it posted its ATH of Rs 186.
It has reached 78% level of retracement and is rebounding from !M FVG(Fair Value Gap).
It is very much likely to start a long term bullish move after it crosses Rs74 level to make new high of Rs 230 In Sha Allah

TRG Bullish Reversal: Buy at Golden PocketTRG is trending after a prolonged bearish phase, forming higher highs and higher lows. It is currently trading around the Fibonacci golden pocket. A buy entry at the current market price is suggested, with a stop loss below the last low and a target at the recent high.
TRG: IN BULLS CONTROLCurrently TRG is trading above a critical level, as marked on the chart. We may initiate a long position with risk and tp defined on the chart.
Good Luck

trg about to breakoutfollowing symmetrical triangle perfectly, needs a breakout from 68.5 and then to 75.. or above shown divergence at 4hrs. previous up move could follow next expected price target. 4hr closing above rsi 50 is necessary for upward breakout


LONGED TRGLonged TRG. Bought spot shares, no leverage. Resting above monthly support. Entry, Stop Loss and Exit all there. Should take a while to play out. Worth a punt!
Will update in due time.
Manage your risk! #DYOR

TRG SHOWING EARLY REVERSAL SIGNSAfter a spell of bearish move the script has shown resilience. It has broken the recent high thus showing the bulls strength so we can join the band wagon to make some profits.
pl exercise the strict money management for profitable trading.
what is ur opinion


TRG is BullishPrice was in a strong downtrend, respecting the descending trendline, however a matured bullish divergence on daily time frame suggests that bulls are trying to assume control of the price action. Now it seems that the descending trendline would be broken by bullish momentum which would potentially lead of a bullish reversal as per Dow theory. Targets are mentioned on the chart.

TRG Trendline Break: Bullish ConfirmationTRG has broken its bearish trendline and the last lower high, with the price now trading above it. A buy above the breakout of the last high is recommended for confirmation of a bullish trend reversal.

TRG Ready for another 16% rideThe stock after breakout its bearish cycle, continuing its bullish ride, recently retraced to mark its LH @ 54 which will be out SL for the trade.
Enter at the breakout of symmetrical triangle at a price of 64.35 for the target price of 74.7 which will be out first TP, approximately 16% gains

TRG gaining Bullish TrendButterfly Harmonic patter visible,
with bullish divergence. Broken its last LH
High chances of a bull rally.


TRG, Bearish Trendline BreakoutWeekly Bearish Trendline Breakout
Bullish activity expected
Buy @ Current price
Stoploss below 43
Take profit on mentioned targets

TRG Pakistan-Buy CallBreak out of descending wedge
Bullish Divergence
Buy limit at breakout of last Lower high

TRG, Bearish Trend ContinuationBearish Trend
Trendline Resistance
No indication of Bullish momentum
Short sell
Entry 1 @ CMP
Entry 2 @ trendline retest
SL 61.5
Target 44-45

TRG is ready to flyTrg is near its strong resistance og 52.6, after crossing it
Next level will be 61.4 and
Next level will be 74.77
Note: This is not a buy/sell call

BUY TRG BEFORE YOU MISSED THE OPPORTUNITY My is trading TRG ,he asked me about it every week so i think why not publish it for other as well...here you can you trg before you missed it....i dont trade this i only trade Gold 😉
