PUMP Long 7xLong 7x
Entry $0.003309
Enter just under 20EMA
Target $0.003569
Sell 100% above 20EMA on Daily and highest close this week
SL $0.0032 Below 200EMA and below lowest close from the week
Risk 6/10
PUMPUSDT.P trade ideas

PUMPUSDT Showing Strong Accumulation StructurePUMPUSDT is developing a compelling base formation, suggesting a possible imminent rally. Price is currently reacting within a key accumulation zone, where early positioning remains strategic. The structure hints at underlying strength, with momentum gradually shifting in favor of bulls.
If the current support zone holds, the setup favors a multi-leg rally. Immediate targets have been mapped for short-term profit-taking, while extended projections align with the final breakout objectives.
Plan: Accumulate within the marked zone and monitor price reaction closely. A break above the immediate neckline will validate continuation toward midterm and final targets.

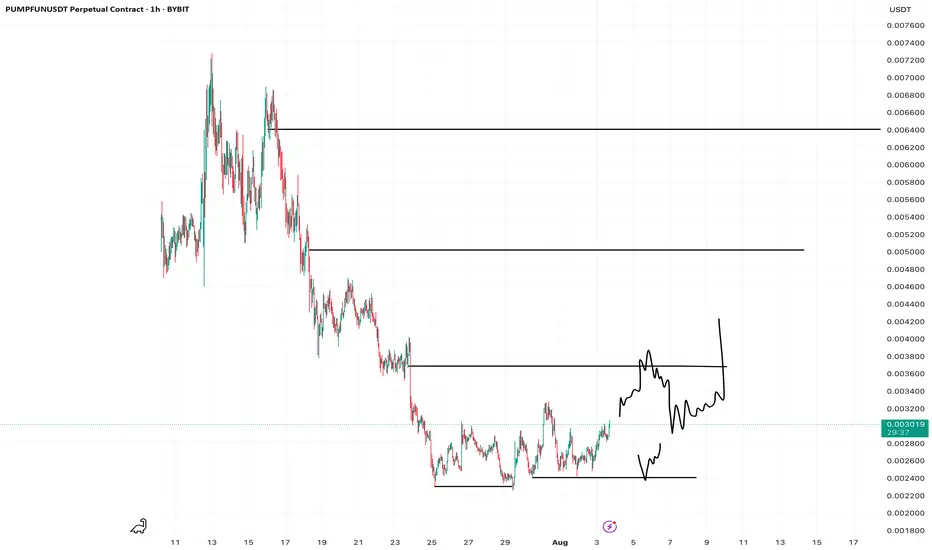
Big Gains Ahead As Pump .fun Eyes 0.0041 Breakout MoveHello✌️
Let’s analyze pump .fun’s price action both technically and fundamentally 📈.
🔍Fundamental analysis:
PUMP. FUN is shifting focus to curated CTO tokens with revenue-sharing, but real success depends on turning hype-driven traders into long-term ecosystem users 🔄
📊Technical analysis:
There are strong indications that this may not be the final leg of the move for BYBIT:PUMPUSDT 📈 A further upside of at least 25 percent remains on the table, with 0.0041 as the next key target.
✨We put love into every post!
Your support inspires us 💛 Drop a comment we’d love to hear from you! Thanks, Mad Whale

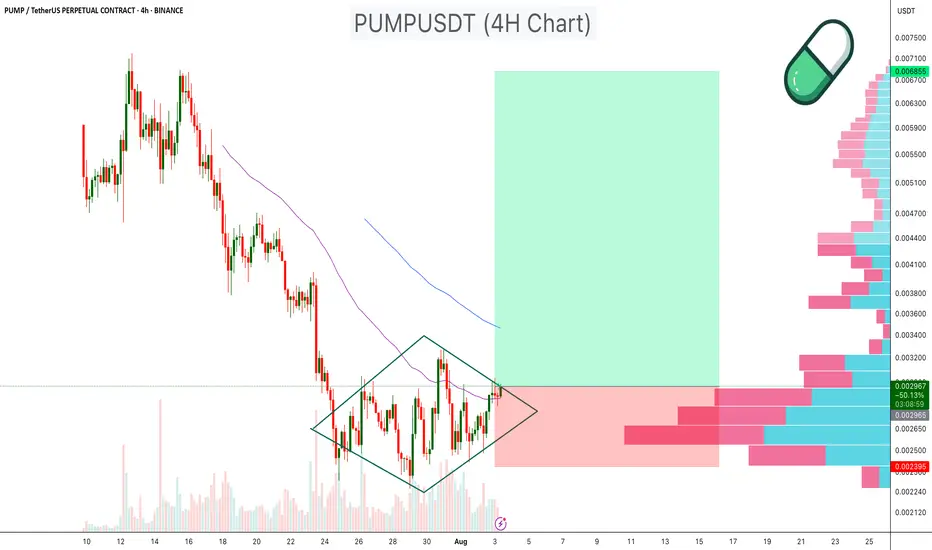
PUMPUSDT Diamond Pattern PUMPUSDT has been consolidating within a diamond chart pattern on the 4 hour timeframe, following a prolonged downtrend. This type of structure signals potential reversal when occurring after a decline.
Diamond Formation: Price is compressing inside converging and diverging trendlines, creating a symmetrical diamond pattern.
Volume Profile Support: Significant volume support is visible in the $0.00240–$0.00250 range, which may act as a strong demand zone.
EMA Resistance: 50 EMA is currently positioned above the price, serving as dynamic resistance.
Breakout Potential: A breakout above the diamond resistance, especially with increased volume, could target the $0.005 –$0.007 zone, representing a major upside move.
Cheers
Hexa
NYSE:PUMP BYBIT:PUMPUSDT
PUMP Long 5xEntry $0.003057
Long 5x
Entry at bounce off 20EMA on hourly
SL $0.002740
Its a big SL and will move up to $0.003050 once it breaks about the 200EMA on the hourly
1st Target $0.003821, Sell 25% which is trend line, then B/E
Than let it run and add to trade on pullback while keeping B/E
It has lots of room to run and can hold for few weeks
Risk 6/10 as it has big SL and its volatile
Risk goes to 0/10 when B/E

PUMP Long 7xEntry $0.003182 - Just below 20EMA and 200EMA
Looking very Bullish above 20 and 200EMA
20EMA crossed 200EMA
SL $0.003
Target $0.003849 Sell 50% - looking to add on pullback
Risk 6/10 - high SL

PUMP 7X LongEntry $0.00315
SL $0.003028 - Below the daily close from yesterday
Sell 50% $0.003223
Sell 100% $0.0034 - On the 20EMA on the Daily
Risk 5/10

$PUMP about to melt faces?We've just broken out of an accumulation phase and it looks primed to rip. Already retested support, so fingers crossed for now.

PUMP - back to fun?Hoping to get that internal sweep at 24; in any case I have a small feeling that this corrects a bit higher soon.
Not gonna buy it here at local highs of course, it would be equal distance to first tp and stop, I don't like it.
so either we sweep or come back into discount at least, or I buy on the s/r flip after taking out tp1. much more difficult to execute of course
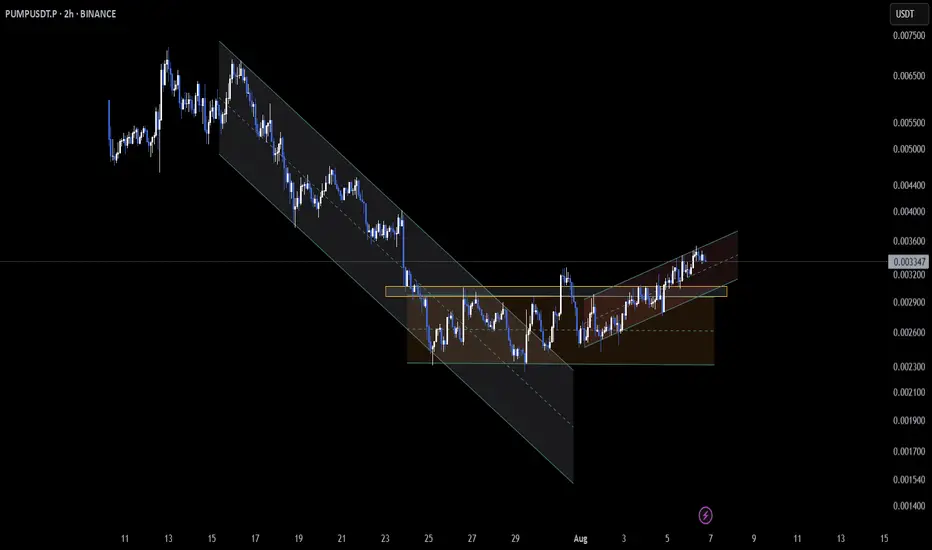
$PUMP forming structure on the 2H timeframePrice is currently moving within an ascending channel, showing consistent higher-lows and higher-highs — a sign of bullish structure building 📈
The next move depends on whether NYSE:PUMP breaks above the upper trendline or breaks down below support ⚠️
A confirmed breakout could trigger momentum to the upside, while a failure to hold structure may lead to a short-term reversal.
Keep this setup on your radar as volatility picks up 👀
Not financial advice — DYOR! BINANCE:PUMPUSDT.P
Pumpdotfun short to $0.002785Thought I shared this earlier. Shorted pumpdotfun . Aiming for $0.002785
It pumped up a bit...no pun intended but structrally its relatively high and likely to correct down again before continuation up.
DTT strategy applied, learn more about it on my x profile.
Sl: $0.003291....if want to hop on now can use 0.032 sl, a bit tigher to give roughly 1-2 RR and still provide good invalidation.

PUMPIMHO once we cross the level above EMA 200 there is launching area to this two zones. Be accurate this thing very active. NFA - DYOR

PUMP/USDT: Whales Buy the Dip as Price Holds Key LevelBINANCE:PUMPUSDT.P price has taken a steep 18% hit in the last 24 hours, but the 2-hour chart shows BINANCE:PUMPUSDT.P price action clinging to a critical Fibonacci support near $0.00259. The token is still trading inside an ascending channel, hinting that the bullish structure hasn’t fully broken yet.
Whales have been scooping up the dip aggressively, adding 5.4 billion PUMP tokens over the past week (a 35.8% jump in their holdings). Despite retail selling pushing netflows positive intraday, big wallets continue to absorb supply. Daily accumulation is also up 3.2% in the last 24 hours, reinforcing the demand floor near current levels.
Meanwhile, long positions dominate the liquidation setup, with $7.88 billion in longs versus just $3.6 billion in shorts. If BINANCE:PUMPUSDT.P price bounces, a cascade of short liquidations could amplify the recovery rally. But failure to defend $0.00259 risks opening the door to $0.00241, putting bulls on the back foot.
For now, the $0.00259–$0.00260 zone is the make-or-break level. Holding above keeps BINANCE:PUMPUSDT.P price inside the bullish channel, setting up a potential retest of $0.00284–$0.00294. A breakdown, however, could flip sentiment sharply bearish.

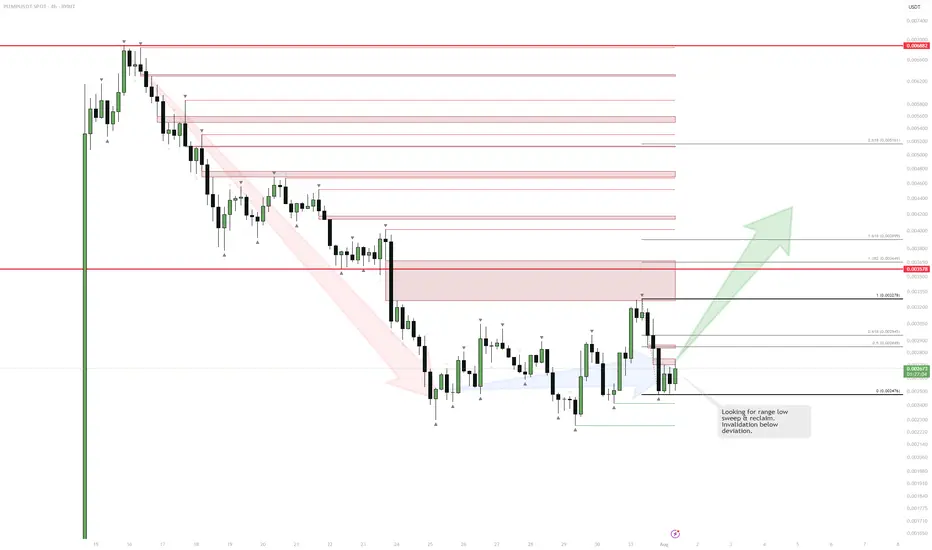
PUMP | Watching for Base ConfirmationThe sharp downtrend is showing signs of exhaustion as price starts to consolidate and build a potential range.
If we see a sweep and reclaim of the range low, that would confirm the start of a new accumulation phase and signal a potential reversal.
The invalidation for any long attempt is a confirmed breakdown below the deviation or the origin of the reclaim.
Plan:
Wait for a clean sweep and reclaim of the range low to trigger a long entry.
Target resistance levels above, with stops set below the reclaim origin.
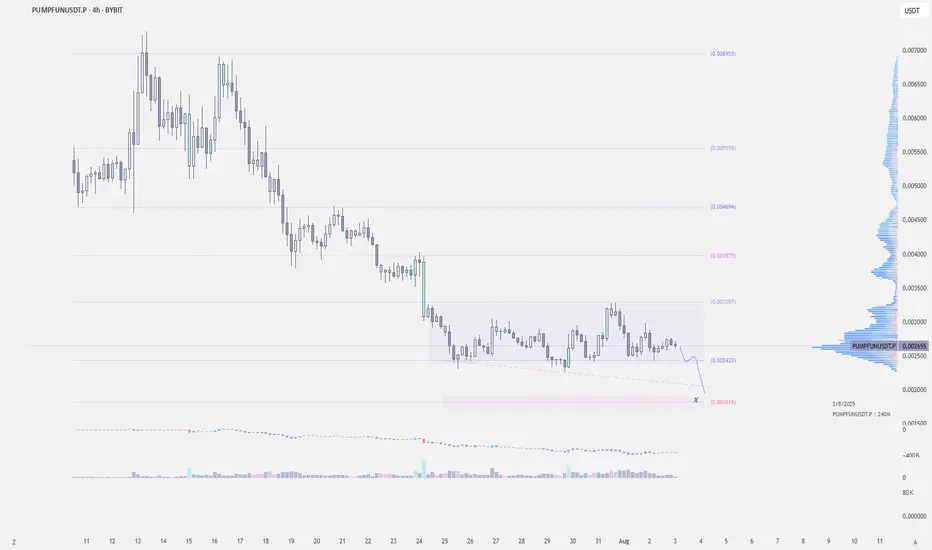
$PUMP May Still Dump to .0020-.0018BYBIT:PUMPUSDT | 4h
PUMPFUN is one of the few coins still holding support during the dump.
It’s looking tempting here, but a drop to the 0.0021–0.0018 zone is still likely.
Planning to long around 0.0021–0.0018
Targets:
.0028-.0032
.0037-.0040
.0045-.0048
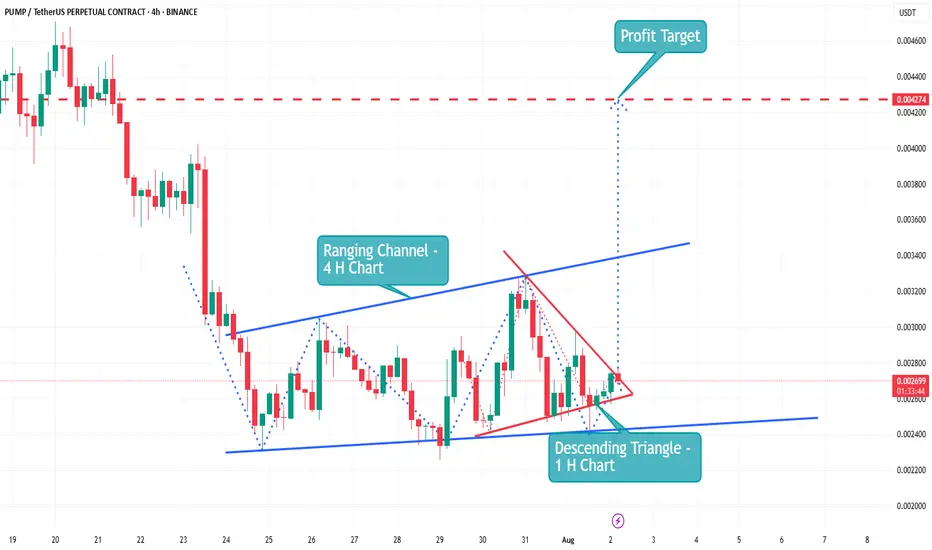
The Pump coin is now showing an upward trend | Live AnalysisPump ▶️
The Pump coin has now touched its All Time Low.🕯
The coin is now showing an upward trend.👀
🛫 a Descending Triangle is currently forming a breakout on the 1H chart.
🛫 Making a Ranging Channel on the 4 H Char
🛫 Make A CHoCH (1H)
🛫 Bullish OB (1H)
🛫 Buy Tag (1 H)
🛫 Making Golden Cross (1 H
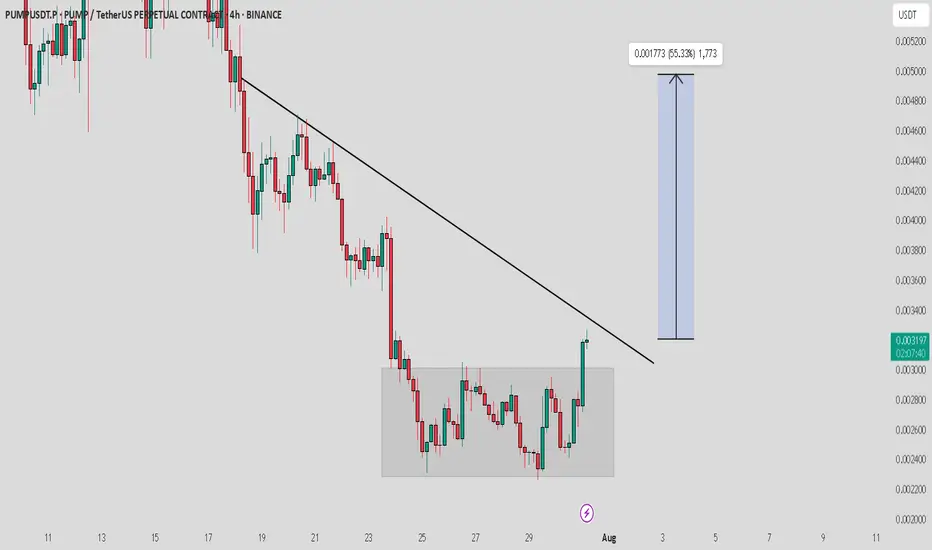
PUMP / USDT : Looking Bullish PUMP/USDT Analysis:
PUMP/USDT shows strong bullish potential after breaking out of consolidation. A retest to the box area is likely before a breakout from the trendline resistance. Once the trendline is broken, expect a major rally with a 40-50% potential upside.
Key Levels:
Support: Consolidation Box
Resistance: Trendline
Wait for confirmation of the trendline breakout before entering. Always manage risk with a stop-loss and stay patient for a clear move. The setup looks promising for a solid bullish rally!
PUMP | #4h #long — Watching for Breakout Confirmation Early signals for a reversal, but not rushing in.
Some clear bullish divergence on the 4h RSI — first positive sign after an extended downtrend. Price can pop from here, but my plan is to wait for a break and hold above the 4h Order Block + MSS zone (red box) before taking any long entry.
Confirmation is key — I only want to get involved if we reclaim this area with momentum.
Scenario:
If we get a strong breakout and close above the red OB + MSS zone, that’s the first entry trigger for a potential trend reversal.
Until then — standing aside, letting the setup prove itself.
Reasoning:
Bullish RSI divergence often marks the beginning of a reversal, but without a structural breakout, the move can easily fail.
Patience pays off in these high-risk, low-liquidity coins.

PUMP LONG TRADE SETUPNew Trade Setup: PUMP-USDT
LONG
Entry: 0.003563 OR CMP
Target: TP1: 0.003862, TP2: 0.004128, TP3: 0.004393, TP4: 0.004658
Stoploss: 0.002801
Leverage: 1X
Technical Analysis: PUMP/USDT has been accumulating for a long time. A breakout has occurred from the recent accumulation, and there's a high chance the price will skyrocket soon.

PUMP Short 5xEntry $0.00356
SL $0.003707 - High on Daily from today
Sell 50% $0.00325 - On the 100EMA on the Daily
Sell 100% $0.00314
Risk 5/10

PUMPThis looks solid. I expect $0.004.
We tested the previous highs and now it will go to $0.004.
I can always be wrong, but if it drops below $0.003, I will close the position.

Long 7x PUMPEntry is market
SL $0.003181
1st target $0.003561 Sell 50%
Final target $0.003555
Risk 5/10
Market is VERY Bullish

PUMPUSDT: Bullish Breakout and Retest - A Potential 34% Upside?Hello, traders!
Today we're looking at the PUMP/USDT pair on the 4-hour timeframe, and a very clean technical setup is unfolding that points towards potential bullish continuation. Let's break down the key elements of this analysis.
The Analysis
The chart presents a classic breakout and retest scenario, which is often a strong indicator of a trend reversal or continuation.
Descending Trendline Breakout: The most significant feature is the decisive breakout from a major descending trendline that had been capping the price for a considerable period. Breaking this trendline is a primary signal that the previous bearish momentum is weakening and buyers are starting to take control.
Break of Horizontal Resistance (S/R Flip): Following the trendline break, the price also successfully pushed through a key horizontal resistance zone, identified on the chart between approximately $0.002966 and $0.003044. This level has now, as expected, turned into a new support base.
The Retest: We are currently witnessing a pullback to this newly established support zone. This "retest" is a critical phase. A strong bounce from this level would confirm the breakout's validity and suggest that the market has accepted this price floor, paving the way for the next leg up.
Volume Confirmation: Notice the volume bars at the bottom of the chart. There was a visible spike in volume during the initial breakout candles, which adds conviction to the move. It indicates that the breakout was backed by significant buying interest.
The Trade Idea
Based on this structure, a potential long opportunity presents itself.
Entry: A favorable entry point could be found within the current support zone ($0.002966 - $0.003044), especially upon seeing confirmation of a bounce (e.g., a bullish engulfing candle or a hammer on the 4H or 1H chart).
Target: The analysis points to a primary target at the next major resistance level, located around the $0.004000 psychological mark. As measured on the chart, this represents a potential upside of over 34%.
Invalidation: This bullish outlook would be invalidated if the price fails to hold the current support and decisively closes back below the $0.002966 level. Placing a stop-loss below this zone is a prudent risk management strategy.
Conclusion
In summary, PUMPUSDT is displaying a textbook bullish setup. The combination of a trendline breakout, an S/R flip, and a live retest offers a compelling case for potential upside. As always, manage your risk carefully and wait for your preferred confirmation signals before entering a trade.
Disclaimer: This is not financial advice. The analysis provided is for educational and informational purposes only. Trading cryptocurrencies involves a high level of risk. Please conduct your own research and risk assessment before making any investment decisions.
