From Hype to Hesitation: What’s Next for Pump Fun ($PUMP)?Today, I want to break down the recent developments and fundamentals of Pump fun ( BYBIT:PUMPUSDT ) and its token PUMP — a project that initially launched with strong hype but is now facing serious investor concerns .
What is Pump fun?
Pump fun is a memecoin launchpad that allows users to launch and trade memecoins in a gamified, simplified environment. The idea was to create a frictionless way for anyone to generate and speculate on meme tokens, leveraging viral growth and community culture.
Its native token, PUMP , was introduced via an ICO priced at $0.004, with 12.5% of the total 1 trillion supply offered during the sale.
Latest Updates – Past 24 Hours Recap
PUMP Crashes Over 50% After ICO :
The token initially spiked to $0.0068 on launch day (July 16) , but has now dropped over 50%.
This is roughly 14% below its ICO price , creating concerns for short-term investors.
Founder Confirms No Airdrop Anytime Soon:
In a livestream with ThreadGuy , project founder Alon Cohen confirmed:
“ The airdrop is not going to be taking place in the immediate future. ”
While the team still plans to deliver an airdrop, Alon emphasized it must be well-executed and meaningful, not rushed for hype.
The current focus is on long-term growth and ecosystem sustainability, not short-term incentives.
Mixed Investor Sentiment:
High-profile trader Machi Big Brother ( Jeffrey Huang ) reportedly increased his long position in PUMP — even though he’s down over $5.8M on his position.
Meanwhile, two wallets linked to private sale investors dumped over 1.2B PUMP at $0.003 , taking a combined loss of $1.19M.
Declining Volume and Market Cap:
Trading volume has dropped significantly.
PUMP has lost over 40% of its value in the past 7 days.
Short-term holders appear uncertain, while the project team asks for patience and long-term vision.
Fundamental Outlook:
Pump fun’s future now heavily depends on:
The real utility of the platform as a meme coin incubator.
The team’s ability to regain trust after delaying the airdrop.
Whether new features or hype can revive volume and user engagement.
-------------------------------
Now, let's examine the PUMP token from a technical analysis perspective
From the outset, I must say that due to the small number of candlesticks that create the PUMP token, technical analysis may be a bit difficult , but we will use technical analysis tools to analyze this token.
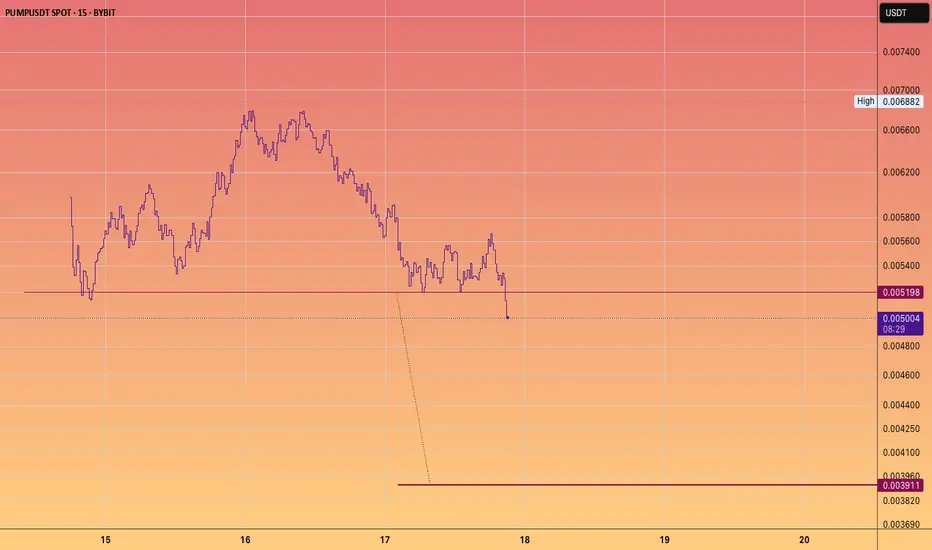
The PUMP token seems to be moving in a descending channel since the beginning of its correction (over -50%) until now, we need a second price bottom to confirm the descending channel.
I expect the PUMP token to rise from the Potential Reversal Zone(PRZ) and near the Support lines to $0.0029(+15%) . PUMP Token increase can also be from the bottom of the ascending channel .
Second target: the upper line of the ascending channel.
Cumulative Long Liquidation Leverage: $0.002810-$0.002530
Cumulative Short Liquidation Leverage: $0.003498-$0.00327
Note: Stop Loss(SL): $0.002391
Please respect each other's ideas and express them politely if you agree or disagree.
Pump fun Analyze (PUMPUSDT), 1-hour time frame.
Be sure to follow the updated ideas.
Do not forget to put a Stop loss for your positions (For every position you want to open).
Please follow your strategy and updates; this is just my Idea, and I will gladly see your ideas in this post.
Please do not forget the ✅' like '✅ button 🙏😊 & Share it with your friends; thanks, and Trade safe.
PUMPUSDT trade ideas

PUMP Trend Reversal – Testing 1H Supply FlipStep-by-step Price Scenario:
Price has broken the local downtrend and reclaimed the 1H supply zone, showing LTF strength.
Look for acceptance above 0.00445–0.00452 green zone for confirmation of the reversal.
If price holds above this zone, expect a move toward the next supply levels at 0.0048, then 0.0050, and 0.0054.
If price loses the green zone (close below 0.00436), scenario is invalidated—look for a retest of the previous lows near 0.00394.
Reasoning:
After a strong local downtrend, price has started to show reversal signs with a clear break and reclaim of the 1H supply zone. This area previously acted as resistance and now flipped to support, signaling the potential for a short-term rally. If buyers manage to hold above this new support, it would confirm the strength of the reversal and open up the path to test the next local supply zones above. However, failure to hold the reclaimed level (close below 0.00436) would invalidate this scenario and suggest the downtrend may continue. This setup is based on a classical supply/demand flip and early signs of bullish momentum on lower timeframes.

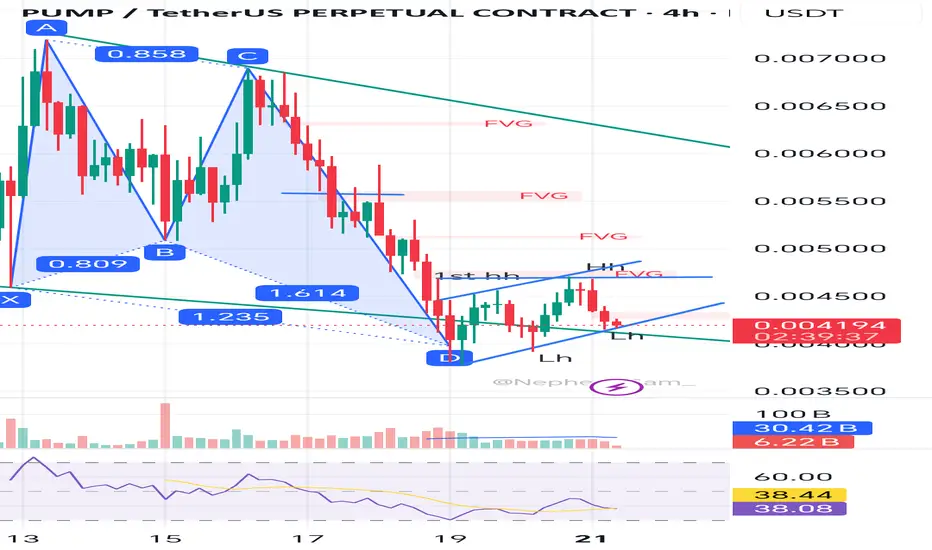
Bullish harmonic but with hidden rising flagThis is mine 2nd post this counter.
Pump just done a higher high and retest created a lower high.
But ytd higher high is not strong, it is in rising flag or rising wedge channel. Might have potential continuation pattern to go Down.. Currently it is still in downtrend anyway.
Still Not an A+ setup in this moment. He needs more times to prove himself.
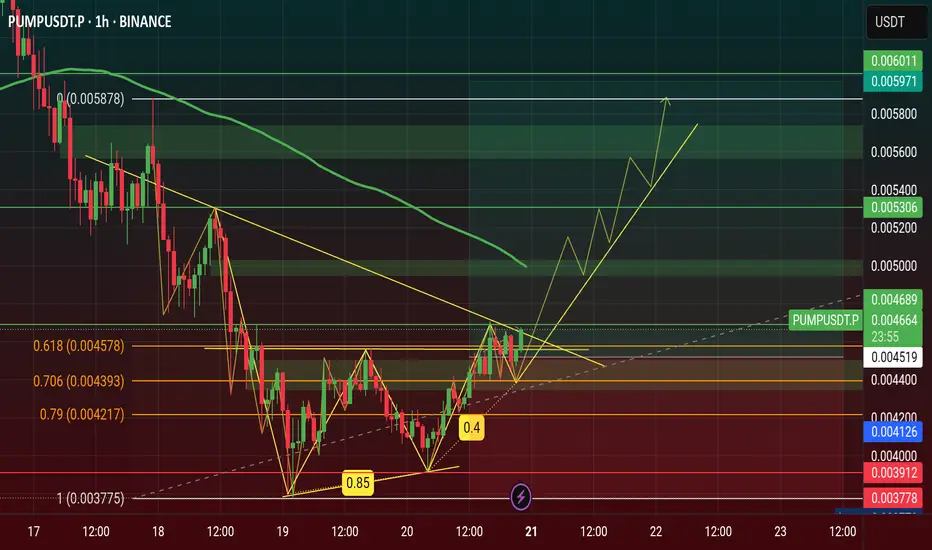
Pump token. Long after correction!📈 PUMP/USDT – Long Setup on Structural Support | Fib & Gaussian Confluence
PUMP is currently experiencing a short-term rejection from local resistance, and has broken below the rising black trendline, now retesting it from the underside — a common bearish retest. Additionally, a short signal (red dot) has appeared on my MC indicator, confirming near-term selling pressure.
However, I see this as an opportunity to prepare for a high-probability long entry.
📍 Entry Zone: $0.0042 – $0.0043
This area aligns with:
Local structural support
The 0.618 Fibonacci retracement of the recent bullish impulse
The lower band of the Gaussian channel
📊 Take Profit Levels:
TP1: $0.00496 (0.382 Fibo)
TP2: $0.00532 (0.5 Fibo)
TP3: $0.00569 (0.618 Fibo)
🎯 This setup offers a strong confluence of technical signals and risk-reward structure for a potential continuation move upward. I’m monitoring closely for bullish confirmation within the buy zone before entering.
🧠 Not financial advice. Trade safe & good luck!

$PUMP Price Will Hit $0.006 this July 2025 see on Chart...🚀 NYSE:PUMP Price Will Hit $0.006 this July 2025, NYSE:PUMP is Showing a Double Bottom Pattern Looking on Chart now.
Double Bottom Pattern is a Reversal Pattern and It's will Manipulation Price of Pump. I'm Find a Three White Shoulders Candle in bottom price area on 4h Chart & It is a Bullish Candle. Now Price Retest and If it's Breakout it will be happened this month.
#Write2Earn #TrendingPredictions #AltcoinSeasonLoading #pump #SUBROOFFICIAL
Disclaimer: This article is for informational purposes only and does not constitute financial advice. Always conduct your own research before making any investment decisions. Digital asset prices are subject to high market risk and price volatility. The value of your investment may go down or up, and you may not get back the amount invested. You are solely responsible for your investment decisions and Binance is not available for any losses you may incur. Past performance is not a reliable predictor of future performance.
$PUMP - Jew ModeBYBIT:PUMPUSDT | 1h
It has dropped below its ICO price level $0.004, currently trading around $0.00373. The drop seems driven by airdrop anticipation and broader market cooldown.
If they stagger the airdrop, it could be a bullish move—reducing supply shock and pushing platform engagement.
Price looks to have bottomed, but still feels uncooked — we’d prefer to see a shakeout to flush early longs
Watching for a potential long around $0.0030
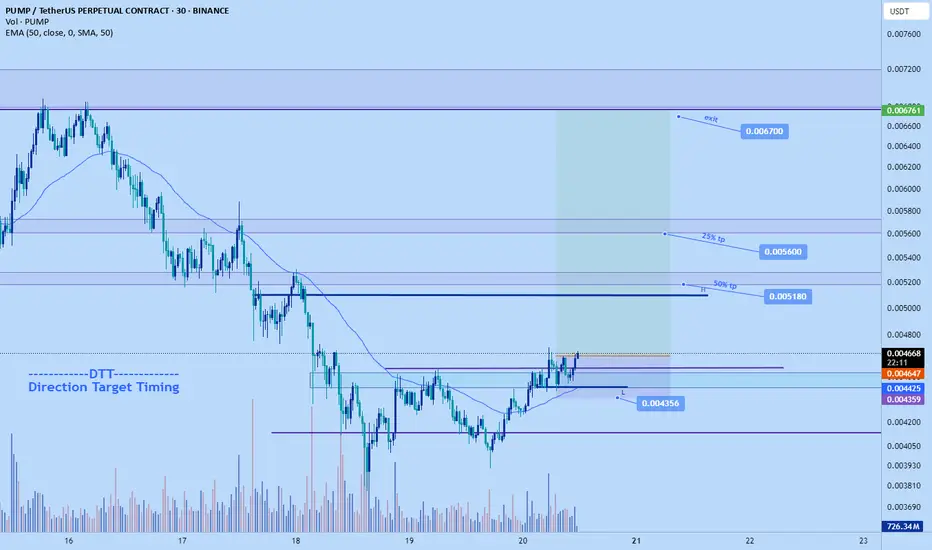
Pumpdotfun long back to $0.0067+pumpdotfun Long
Sl: $0.004356
Tp1: $0.005180---50%
Tp2: $0.0056---25%
Exit: $0.0067
DT strategy applied.
Time sensitive
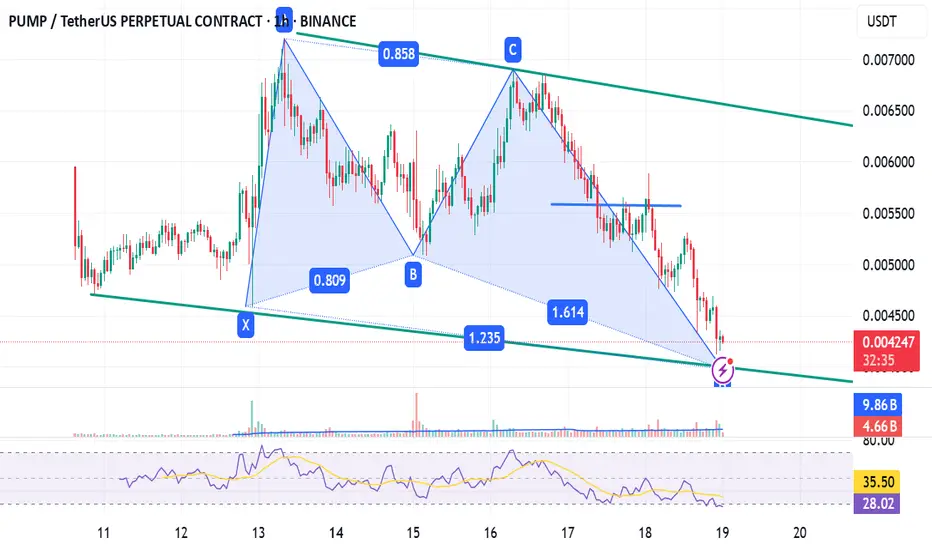
pumpusdt bullish butterfly harmonic patternpossibility forming butterfly harmonic pattern.
but the counter is still in down trend.
counter may fell deeper, high possibility anyway.
may look for entry after change market structure with choch in 1hr tf, then only consider it.
must wait for confirmation with test 1st only consider.
next potential support is on fibo 2.618.
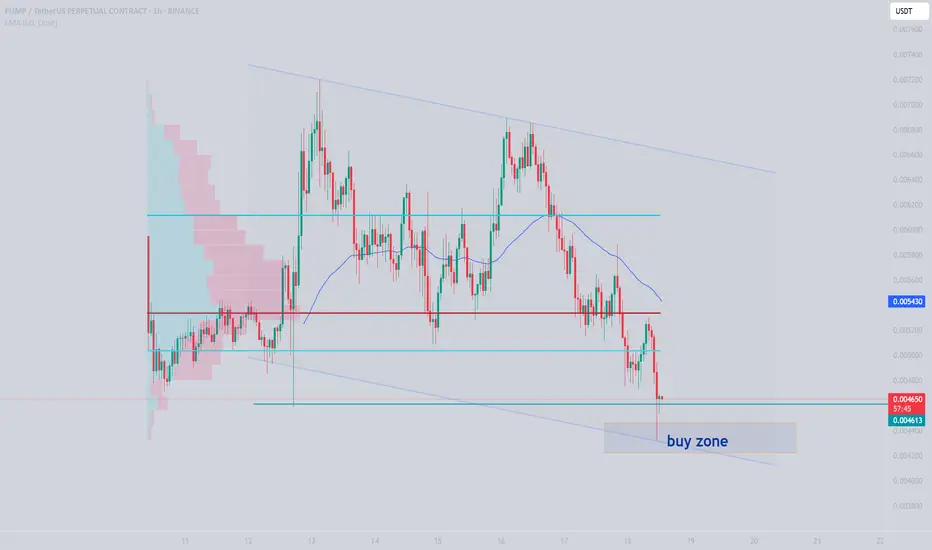
pumpusdtGiven the current price conditions and the attention this token has garnered, it is worth taking a risk step at the bottom of its descending channel for much higher targets.
PUMP/USDTCurrent Market Structure
Strong pump occurred around July 13th, peaking above 0.0072.
Price retraced and is now ranging between 0.00580 – 0.00640.
Appears to be forming a consolidation or flag pattern, which can break either way.
Volume is declining, indicating potential for breakout buildup.

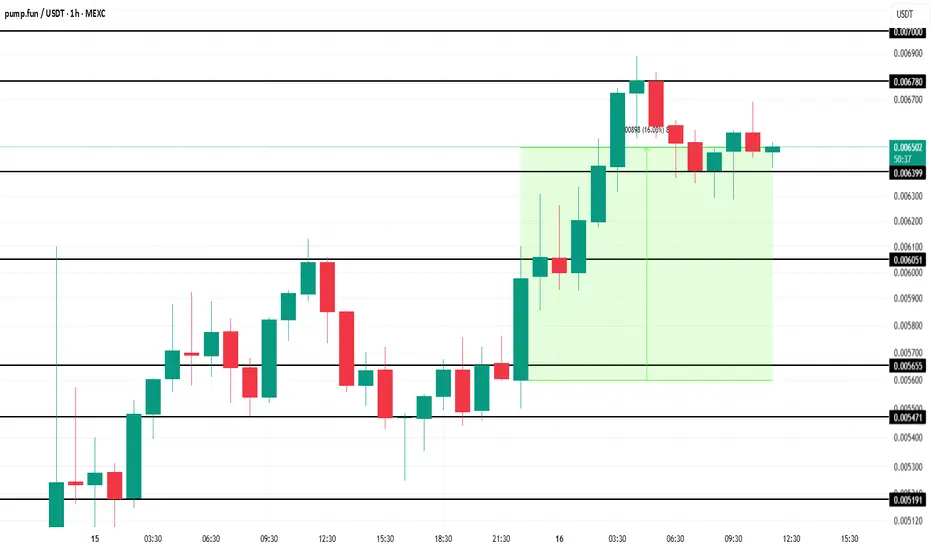
Pump.Fun (PUMP) Token Nears Milestone $1 Billion OI In 3 DaysMEXC:PUMPUSDT price stands at $0.0065 after bouncing off the $0.0063 support level. The token has gained 16% in the last 12 hours , showing that the demand for PUMP is strong.
The valuation of Pump.Fun has skyrocketed in just two days, reflecting a surge in demand. In only 48 hours since its launch, the altcoin has amassed 45,500 holders .
The macro momentum behind Pump.Fun is undeniable, with open interest in MEXC:PUMPUSDT nearing $913 million. It is on track to hit the $1 billion mark by day three of its launch.
Given the ongoing momentum and investor confidence, the token is likely to continue pushing upwards in the near future.
With the current market conditions and growing support, MEXC:PUMPUSDT could breach the $0.0067 resistance and reach as high as $0.0070 in the coming days. This would mark a significant achievement for the altcoin, continuing its impressive upward trajectory.
However, if MEXC:PUMPUSDT faces a sudden wave of selling or broader market bearishness, the token could lose the $0.0063 support level. A decline below this point would likely see PUMP slipping to $0.0060, invalidating the bullish outlook and signaling a potential market correction.
#PUMP is trying to break out of the falling channel! #PUMP Our previous trade setup, SL, got hit.
Currently, it is trying to break out of the falling channel on the 1H chart.
If it holds above the breakout zone, it could push toward $0.0082 📈
Entry: 0.0060 – 0.0063
Stop Loss: 0.00578
Targets:
TP1: 0.0068
TP2: 0.0074
TP3: 0.00795
TP4: 0.00823
Classic breakout setup, strong R: R potential ahead
DYOR | NFA


Pump.fun (PUMP) Price Crashes 20% After First Bearish CrossoverMEXC:PUMPUSDT price is currently at $0.003055, down by nearly 20% in the last 24 hours . The MACD (Moving Average Convergence Divergence) indicator, a key tool used to track price momentum, has signaled the first bearish crossover for PUMP token since its launch.
The bearish crossover occurred after a period of rising bullish momentum, signaling that the altcoin may now be facing a downturn.
The token is holding above a key support level of $0.002921 , but this support is fragile. If MEXC:PUMPUSDT fails to maintain this level, it could continue to decline, potentially dropping to $0.002499 . This would confirm the continuation of the downtrend, and the price could fall further.
On the other hand, if MEXC:PUMPUSDT manages to hold its ground at $0.002921, it could experience a bounce back. This would allow the altcoin to rise towards $0.003803, potentially invalidating the current bearish thesis and pushing the price past the resistance of $0.004124 . The next few days will be critical in determining if PUMP can recover from its recent losses.

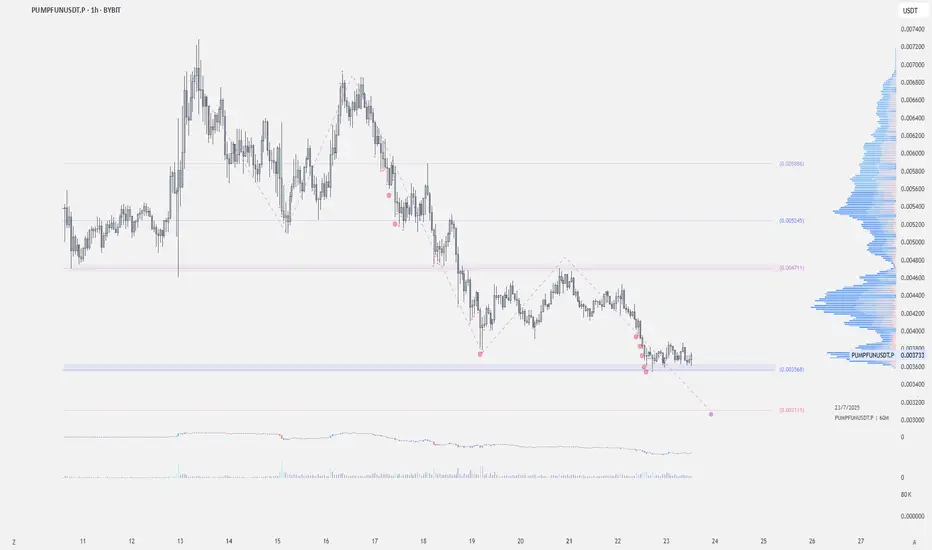
pumpusdtGiven the current conditions and the distance that the price has taken from its volume and price value, I give the possibility of using these areas and ultimately using them at the end of the major movement step that has been identified, and as long as the price does not turn, I will continue my step buying.


Where Should We Rebuy The PUMP? (8H)With the large bearish master candle formed at the top, the structure has turned bearish.
The green zone is the best and lowest-risk area for long positions or rebuys.
Reaching this zone may take some time, but you can already add this symbol to your watchlist and wait for it to reach the area before entering a position.
A 25%–45% return can be expected from this zone.
A daily candle closing below the invalidation level will invalidate this analysis.
For risk management, please don't forget stop loss and capital management
Comment if you have any questions
Thank You

$PUMP’s Support Holds at $0.15 – Reversal Signal?Analysis: NYSE:PUMP at $0.167 is holding above the $0.15 support, with a bullish hammer on the 4-hour chart. Resistance at $0.17 remains a hurdle. RSI is neutral at 55. Recommendation: Buy dips to $0.15; target $0.18, stop below $0.145.

$PUMP’s Fibonacci Retracement Targets $0.20Analysis: NYSE:PUMP at $0.167 is approaching the 61.8% Fibonacci level ($0.17) from its recent low of $0.09. A break could target the 100% level at $0.20. Support at $0.14 is key. Recommendation: Buy above $0.17; sell partials at $0.20.

$PUMP’s Stochastic at 60 – Room for Growth?Analysis: At $0.167, NYSE:PUMP ’s Stochastic Oscillator is at 60 on the daily chart, suggesting room for upside before overbought levels. Resistance at $0.17 is critical; support at $0.15 holds. Recommendation: Long on a break above $0.17; stop below $0.15.

$PUMP’s Volume Spikes at $0.167 – Breakout Imminent?Analysis: NYSE:PUMP ’s 24-hour volume has spiked, supporting its price at $0.167. The price is above the 50-day MA ($0.14), with $0.17 as resistance. A breakout needs sustained volume. Recommendation: Buy above $0.17; watch for volume contraction.

$PUMP Faces $0.17 Resistance – Rejection Risk HighAnalysis: NYSE:PUMP at $0.167 is struggling to break $0.17 resistance, with declining volume on the 1-hour chart. The 50-period EMA at $0.155 is support. A rejection could test $0.15. Recommendation: Short below $0.165; target $0.15, stop at $0.172.
