for education purpose Not Fınancıal AdviseThe given chart shows that 1.210 important resistance if it breaks, we may see;
TP1:1.263
TP2: 1.330
TP3:1.416
Btw, Pundıx has some good news this week as you know (burn).
PUNDIXUSDT.P trade ideas


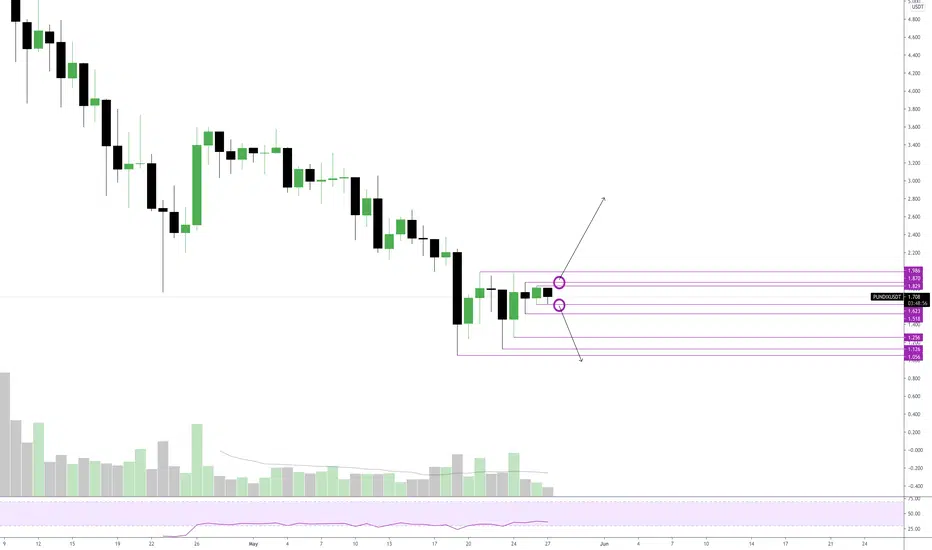
Pundix/Usdt📍PUNDIX/USDT📍
Type : SPOT📈
ENTRY: $1.250 - $1.260
TARGETS: $1.275 , $1.290 , $1.320
STOPLOSS: 1.1$

Pundi X completing bullish Shark for upto 26.5% moveHi, dear friends, hope you are well and welcome to the new update on Pundi X token.
On the 4-hourly chart, the price action of Pundi X is forming the bullish Shark pattern.
Buying and sell targets for Shark move:
Buy between: $1.31 to $1.23
Sell between: 1.39 to $1.557
Stop loss:
The maximum extent of potential reversal zone at 1.13 Fib level can be used as stop-loss which is $1.23.
Possible profit and loss ratio:
As per the above targets, this trade has a profit possibility of 26.5%, and a loss possibility of up to 7%.
Note: Above idea is for educational purpose only. It is advised to diversify and strictly follow the stop loss, and don't get stuck with trade.


Do Not Sell Your Pundi X After This Fake OutHey friends hope you are well and welcome to the new update on the Pundi X
A Fake out:
The price action of Pundi X formed a symmetrical triangle on 4-hour chart and broke out the resistance. After breaking out it also re-tested the previous resistance of the triangle as support but could not close above the high of the breakout candlestick and moved down and even broke down the support of the triangle.
A new descending triangle formation:
After breaking down the symmetrical triangle the price action has found a support at $1.53. Now if we connect all the confluence points of resistance and support then a new descending triangle has been formed and target for this triangle can be $2 in case of breakout.
Different support and resistance levels:
After the drop of 19th may, the price action of Pundi X has found a new support at $1.53. The next resistance is at $2. The $2 can be the most strong resistance as it has been working as a strong support previously:
Different indicators:
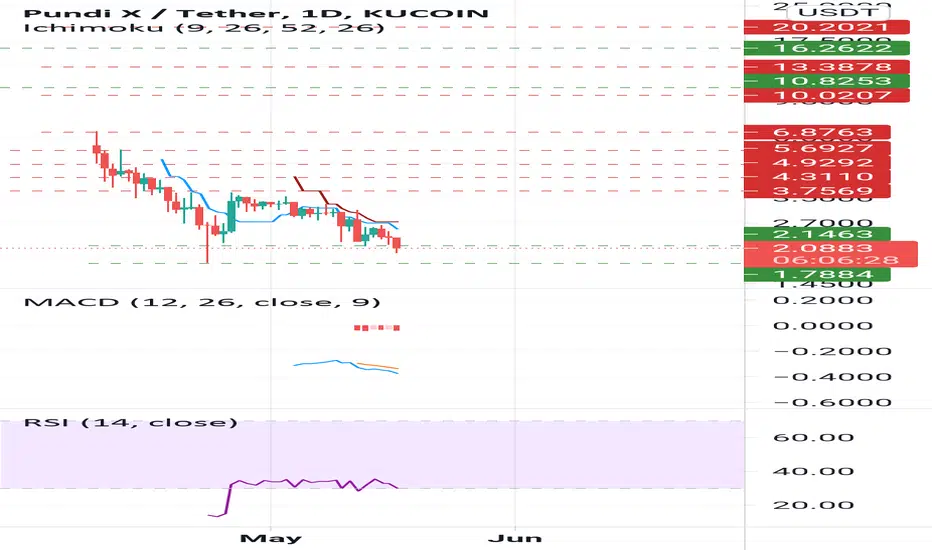
On the 4-hourly chart the price action has moved below the Ichimoku bullish cloud now it can work as a resistance.
If we take a look at the Directional movement index then there is a sell signal appeared. Once it will give the bullish signal then we can expect another attempt for the powerful breakout.
Conclusion:
The price action has broken down the triangle but it was due to some market manipulation therefore the price action stopped at the next support. Now for any big move we should wait for the breakout from this newly formed triangle and the $2 resistance level.


Pundi X[new] broke out the triangle a good long opportunityDear friends, the Pundi X has broken out the triangle on 4-hour chart, as the price action has re-tested the resistance of triangle as support and confirmed the breakout.
Sell targets:
The technical sell target as per the symmetrical triangle for this trade is $2.
Stop loss:
Stop loss is $1.60 as it is the recent swing low before the breakout.
Note: Above idea is for educational purpose only. It is advised to diversify and strictly follow the stop loss, and don't get stuck with trade


PUNDİX/USDT Maybe this chart....Sory guys. My last pundix chart failed becuase BTC crashed. I will follow on this. Stay hodl. NFA


PUNDIXUSDT - daily chartOn the daily chart we are creating a very tight range , which IMO soon will result into a volume spike.
I personally would wait to see if we break the highs or lows to make a entry.
For every new follower i will add a new idea :)
PUNDIX storiesHi all
PUNDIX is a great project and I firmly believe in it. If FA and TA agree with me, we are in for a massive upward trend.
The falling wedge could of course be broken much sooner than on leg e, but would not be quite complete, which is why I drew it that way.
What do You think?


Buy and WaitLook at my ex posts, each time I made minimum x2. This project is great and the graph tells me keep your pundix and you will get a big prize.

PundixAfter a correction pundix is getting ready to start a bullish rally
I set the buy price
Set stop loss
Buy at dip and be patiant short midterm

PUNDIXUSDT|LONGPRICE BROKEN OUT THE TRENDLINE AND ITS NOT IN THE PROCESS OF RETRACEMENT THEREFORE ITS EXPECTED TO GO FOR LONG


