PUNDIXUSDT TODAY1-Apply your own risk management.
2-Daily and Weekly Targets
3-Hunt the profits at any level you see convenient for you.
4-Gonna SPOT IT WITH 12%
have a good day guys.
PUNDIXUSDT trade ideas

Pundix begins it's move!As you can see from this setup, Pundix has converged perfectly to make a huge rebound to the upsides. The charts have shown us straight to our face. A clear signal point for the reversal. Expect big moves coming soon because things are getting extremely bullish for the whole altcoin markets!

Pundix On Fire: Don't Miss Out on This Buy Trade!"**Pundi X (PUNDIX)** is a blockchain project that aims to make cryptocurrency payments accessible to everyone. It has developed a number of products and services to achieve this goal, including the XPOS point-of-sale system, the XWallet mobile app, and the Function X blockchain.
**Recent News**
* On October 25, 2023, Pundi X announced that it had partnered with Mastercard to allow merchants to accept cryptocurrency payments in stores.
* On October 24, 2023, Pundi X announced that it had launched its Function X blockchain mainnet.
* On October 23, 2023, Pundi X announced that it had acquired the crypto exchange FXT.
**Short Fundamental Analysis**
Pundi X has a number of strengths that make it a promising investment. First, it has a strong team with experience in the blockchain and fintech industries. Second, it has a number of products and services that are already in use by businesses and consumers around the world. Third, it has a strong community of supporters who are passionate about its mission.
However, Pundi X also faces some challenges. First, the cryptocurrency market is still volatile and unpredictable. Second, Pundi X faces competition from other companies that are also developing products and services to make cryptocurrency payments more accessible.
**Disclaimer**
This is not financial advice. Please do your own research before investing in any cryptocurrency.

PUNDIX SPOTBreakout imminent.
Awaiting multiple daily candle closes
Can target $2 after that which is close to 5x on spot.

Support range: 0.3113-0.3560Hello?
Hello traders!
If you "Follow" us, you can always get new information quickly.
Please also click “Boost”.
Have a good day.
-------------------------------------
(PUNDIXUSDT chart)
The key is whether the price can be maintained by rising above the 0.4288-0.5108 range.
(1D chart)
On the current chart, it appears that it must rise above at least 0.759 to escape the bottom section.
If you touch the HA-Low indicator, go up, touch the HA-High indicator, and then fall again and touch the HA-Low indicator, it is considered to be a trend reversal period.
Accordingly, we can see that the trend reversal has failed so far.
This time, if it receives support in the 0.3113-0.3560 range and rises above the 0.3830-0.43 range to maintain the price, it is expected that the trend will be successfully reversed.
However, we need to check whether it can rise above the previous box range of 0.4720-0.6470.
-------------------------------------------------- -------------------------------------------
** All explanations are for reference only and do not guarantee profit or loss in investment.
** Trading volume is displayed as a candle body based on 10EMA.
How to display (in order from darkest to darkest)
More than 3 times the trading volume of 10EMA > 2.5 times > 2.0 times > 1.25 times > Trading volume below 10EMA
** Even if you know other people’s know-how, it takes a considerable amount of time to make it your own.
** This chart was created using my know-how.
---------------------------------


PundiX MASSIVE UPSIDE POTENTIALPossible accumulation happening in this range for a while now. As crypto markets pick up the upside here is massive. In the previous bull run PundiX did a 50X+ so this time around its a NO BRAINER. PundiX has been consistent in spreading their products globally with partnerships and physical locations in Turkey and now licensed in the Middle East.

BUY PUNDIXPundiX has had a healthy accumulation range with a tipple bottom. It's a good time to buy before the next bullrun cycle. Potential 50-100X returns.

PUNDIXUSDTIt is possible on the logarithmic chart to see the price on the hatch line
Set your SL. It is a buy opportunity I think

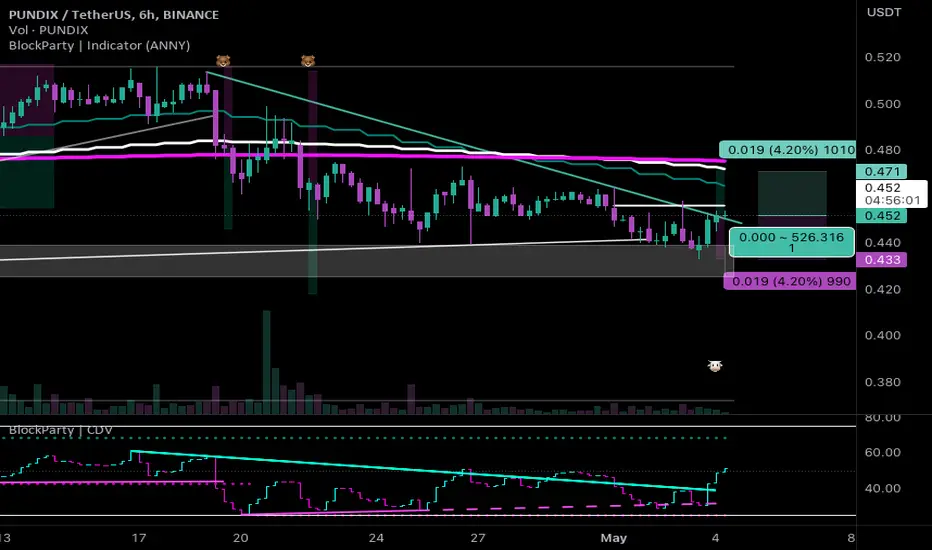
PUNDIX - Long - Potential 4.20%Direction: Long
Market: Spot
Risk: 0.25% - 1%
#USDT_PUNDIX
Exchange: BINANCE
Timeframe: 360
TP1: 0.471
Entry: 0.452
STOP: 0.433
Entry Conditions:
| Trendline break from support
| Delta volume trendbreak
| At support
A huge breakout for Pundi X!!Will we see all time highs coming in this breakout!? We'll have to wait and see. It looks like it's definitely pushed through and doesn't seem like it's slowing down as of yet.

Finally Pundix Breaking Long Downtrend Seems Like Pundix Has Already Bottomed Out Moving Averges Golden Cross Also confirming Strength Of Pundix
Testing More Then Year Old Trendline Incase Of breakout Expecting 180 To 200% Bulish Move


PUNDIX - BEARISH PENNANTI am going against the pattern against the pattern here and taking long position as the economic fundamentals seems positive. For risking position against the trend SL must be in place.

Last bottom before bull run$PUNDIX Last bottom before bull run, watch out.
Last support area under $0.2, will going $1 easily..

PundiX another breakout soon?PundiX has tested support three times and now is on its way to test resistance for the third time. Will there be a break out this time? Looking at the fundamentals and the potential of this project we could see a 10-100X in this bull run. If BTC continues its rise as we are predicting than a breakout is the likely scenario. In a bear market the price could fall by as much as 60% however the upside is massive. The upside outweighs the downside so its worth investing in considering how long pundi has been in accumulation recently.


PUNDIX formed big bullish Gartley for upto 89.50% pumpHi friends, hope you are well and welcome to the new trade setup of PUNDIX with US Dollar pair.
On a 4-hour time frame, PUNDIX has formed a bullish Gartley pattern.
Note: Above idea is for educational purpose only. It is advised to diversify and strictly follow the stop loss, and don't get stuck with trade

$pundix- knock knockflip .560 burst to .740 with most likely continuation till 1.144
below .482 invalidation so either fomo in like me or wait for the flip
probably better to wait..

Pundi X (PUNDIX) - August 1Hello?
Welcome, traders.
By "following", you can always get new information quickly.
Please also click "Like".
Have a good day.
-------------------------------------
(PUNDIXUSDT 1W Chart)
The key is whether it can be supported in the 0.772-0.910 section.
(1D chart)
Primary resistance: 0.841
Secondary resistance: 0.910-0.963
Support: 0.738-1.772
In order to continue the upward trend, it must rise above the HA-High indicator.
therefore,
- Maintain the price by rising above 0.963 as it is, or
- It should go down, causing the HA-High indicator to decline.
In order for the uptrend to continue, the horizontal line of the HA-Low indicator must be longer than that of the HA-High indicator.
It is expected to swing up and down to reverse the trend in the current flow.
If the price holds above 0.578, I think it is likely to lead to further gains.
------------------------------------------------------------ -------------------------------------------
** All indicators are lagging indicators.
Therefore, it is important to be aware that the indicator moves accordingly with the movement of price and volume.
However, for the sake of convenience, we are talking in reverse for the interpretation of the indicator.
** The MRHAB-T indicator used in the chart is an indicator of our channel that has not been released yet.
** The OBV indicator was re-created by applying a formula to the DepthHouse Trading indicator, an indicator disclosed by oh92. (Thanks for this.)
** Support or resistance is based on the closing price of the 1D chart.
** All descriptions are for reference only and do not guarantee a profit or loss in investment.
(Short-term Stop Loss can be said to be a point where profit and loss can be preserved or additional entry can be made through split trading. It is a short-term investment perspective.)
---------------------------------

$pundixnot in this but flip yellow and possible blast through blue.
been a while since it did a scam pump

PUNDIX UP 153% after bullish signal 🚀🚀🚀PUNDIX pumped 153% after the bullish Supertrend Ninja - Clean signal (green vertical line on the background). Forming leg C of the Elliot Wave (blue lines).
PUNDIX broke out of the bullish Zone of the Ichimoku Cloud , which is bullish . The RSI is in the overbought zone at 84. RSI Brown at 123. Which is clearly overbought If we take a look at the Average Directional Index ( ADX DI) its starting to be bearish , as it is pointing downwards. Currently PUNDIX is way above its upper Bollinger Band , Band Basis 20 Period SMA . A retrace back within the Bollinger Band is more likely. The risk to reward right now to enter a trade is bad.
After a retrace PUNDIX might possibly go up for another run, before forming bearish divergence. Remember to always take profits and use proper risk management!
Thank you for reading.
Namasté 🙏
Disclaimer: Ideas are for entertainment purposes only. Not financial advice. Your own due diligence is highly advised before entering trades. Past performance is no guarantee of future returns.
What Indicators Do I Like To Use:
I am using the "Supertrend Ninja - Clean", which is a trend-following indicator (Green and red vertical lines on the background). When the background of the candlestick closes green (vertical line). It indicates a possible bullish (up)trend. And red for possible downtrends.

PUNDIX Buy signal As the characteristic of the last price movement has completed 4 waves so far and can have another rise in the form of a 5 wave, this point is also evident in the slowing down of the 4 wave, of course, due to the lengthening of the 4th wave and the decrease. Significantly in the number of active addresses of this currency, the probability of occurrence of wave 5, which is more powerful than wave 3, is very low
Stop loss : 0.82
Profit limit : range 0.94
R/R : 2
