QI Looks Super Bullish (3D)The price has reached a significant zone on the higher timeframes and has failed to create a lower low. Additionally, a major Change of Character (CH) has formed on the chart.
There are signs indicating that the price is attempting to form a double bottom on the higher timeframes.
We have identified two entry points for taking a spot position.
The closure of a daily candle below the invalidation level will invalidate this analysis.
For risk management, please don't forget stop loss and capital management
When we reach the first target, save some profit and then change the stop to entry
Comment if you have any questions
Thank You
QIUSDT trade ideas

BenQI BullishflagREAD CAREFULY PLEASE!
as i checked BENQI formed bullishflag and in timeframe 1W so it can be about 2-3 weeks to blowup you guys have stoploss and everything in chart and i just opened my long

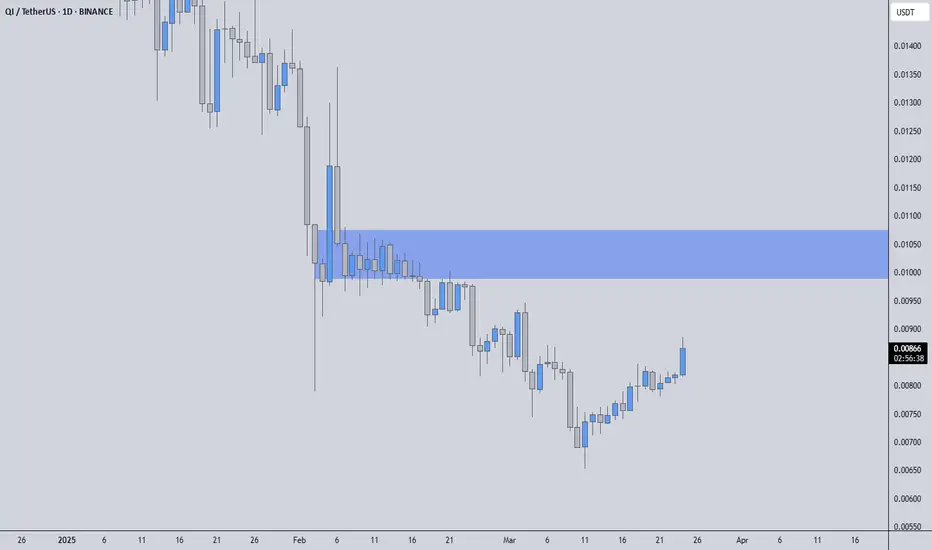
QIUSDT – MASSIVE %284 VOLUME SPIKE!🔥 Key Level Alert: The blue box is a huge resistance zone—we are at a critical decision point. Blind entries = bad trades. Smart entries = profits.
📊 How I’m Approaching This:
✅ Volume Surge = Increased Interest – But where is price heading?
✅ Blue Box = Key Resistance – If we reject, I’ll look for LTF breakdowns + CDV confirmations to short.
✅ Break & Retest? If we push above with volume and confirm on the retest, I’ll flip long instead.
💡 Trading Like a Pro:
I never insist on a short just because it "looks high." If the price breaks up with momentum, I adjust my bias and ride the trend. Flexibility is what separates winners from losers.
🚀 Follow for next-level, no-nonsense trading insights. The market moves, I move smarter. 🔥
I keep my charts clean and simple because I believe clarity leads to better decisions.
My approach is built on years of experience and a solid track record. I don’t claim to know it all, but I’m confident in my ability to spot high-probability setups.
If you would like to learn how to use the heatmap, cumulative volume delta and volume footprint techniques that I use below to determine very accurate demand regions, you can send me a private message. I help anyone who wants it completely free of charge.
I have a long list of my proven technique below:
🎯 ZENUSDT.P: Patience & Profitability | %230 Reaction from the Sniper Entry
🐶 DOGEUSDT.P: Next Move
🎨 RENDERUSDT.P: Opportunity of the Month
💎 ETHUSDT.P: Where to Retrace
🟢 BNBUSDT.P: Potential Surge
📊 BTC Dominance: Reaction Zone
🌊 WAVESUSDT.P: Demand Zone Potential
🟣 UNIUSDT.P: Long-Term Trade
🔵 XRPUSDT.P: Entry Zones
🔗 LINKUSDT.P: Follow The River
📈 BTCUSDT.P: Two Key Demand Zones
🟩 POLUSDT: Bullish Momentum
🌟 PENDLEUSDT.P: Where Opportunity Meets Precision
🔥 BTCUSDT.P: Liquidation of Highly Leveraged Longs
🌊 SOLUSDT.P: SOL's Dip - Your Opportunity
🐸 1000PEPEUSDT.P: Prime Bounce Zone Unlocked
🚀 ETHUSDT.P: Set to Explode - Don't Miss This Game Changer
🤖 IQUSDT: Smart Plan
⚡️ PONDUSDT: A Trade Not Taken Is Better Than a Losing One
💼 STMXUSDT: 2 Buying Areas
🐢 TURBOUSDT: Buy Zones and Buyer Presence
🌍 ICPUSDT.P: Massive Upside Potential | Check the Trade Update For Seeing Results
🟠 IDEXUSDT: Spot Buy Area | %26 Profit if You Trade with MSB
📌 USUALUSDT: Buyers Are Active + %70 Profit in Total
🌟 FORTHUSDT: Sniper Entry +%26 Reaction
🐳 QKCUSDT: Sniper Entry +%57 Reaction
📊 BTC.D: Retest of Key Area Highly Likely
📊 XNOUSDT %80 Reaction with a Simple Blue Box!
I stopped adding to the list because it's kinda tiring to add 5-10 charts in every move but you can check my profile and see that it goes on..
QIUSDT(BENQI) Updated till 06-02-25QIUSDT(BENQI) Daily timeframe range. PA struggling at 0.01129. failed to defend it will lead it back to 0.00789. retrace from 0.00789 was fine but sellers are dragging it back. retrace can continue if buyers can hold it above 0.01129.

#QI (SPOT) IN( 0.01400- 0.01820) T.(0.13500) SL(0.01318)BINANCE:QIUSDT
#QI / USDT
Entry( 0.01400- 0.01820)
SL 1D close below 0.01318
T1 0.03700
T2 0.06300
T3 0.09900
T4 0.13500
1 Extra Targets(optional) in chart, if you like to continue in the trade with making stoploss very high.
______________________________________________________________
Golden Advices.
********************
* collect the coin slowly in the entry range.
* Please calculate your losses before the entry.
* Do not enter any trade you find it not suitable for you.
* No FOMO - No Rush , it is a long journey.
Useful Tags.
****************
My total posts
www.tradingview.com
**********************************************************************************************
#Manta #OMNI #DYM #AI #IO #XAI #ACE #NFP #RAD #WLD #ORDI #BLUR #SUI #VOXEL #AEVO #VITE #APE #RDNT #FLUX #NMR #VANRY #TRB #HBAR #DGB #XEC #ERN #ALT #IO #ACA #HIVE #ASTR #ARDR #PIXEL #LTO #AERGO #SCRT #ATA #HOOK #FLOW #KSM #HFT #MINA #DATA #SC #JOE #RDNT #IQ #CFX #BICO #CTSI #KMD #FXS #DEGO #FORTH #AST #PORTAL #CYBER #RIF #ENJ #ZIL #APT #GALA #STEEM #ONE #LINK #NTRN #COTI #RENDER #ICX #IMX #ALICE #PYR #PORTAL #GRT #GMT #IDEX #NEAR #ICP #ETH #QTUM #VET #QNT #API3 #BURGER #MOVR #SKL #BAND #ETHFI #SAND #IOTX #T #GTC #PDA #GMX #REZ #DUSK #BNX #SPELL #POWR #JOE #TIA #TFUEL #HOT #AVAX #WAXP #OGN #AXS #GALA #ONE #SYS #SCRT #DGB #LIT #QI

QIUSDT: %215 Volume Surge and Buyer ActivityQIUSDT: Significant Volume Surge and Buyer Activity
There is a 215% increase in volume in QIUSDT, indicating heightened market activity. This suggests buyers are stepping into the market and adding pressure. However, given the dynamics of the market, I will focus on evaluating specific breakout opportunities.
📌 Key Strategy:
When the price approaches the blue box zones, these areas will serve as potential demand zones. I will closely monitor lower time frame upward breakouts from these regions to identify high-probability entries.
🔑 Why the Blue Box Matters:
It represents areas of increased buyer interest.
Volume spikes coupled with price movements from these zones often yield strong reactions.
I will remain cautious of false breakouts but will prioritize stable movements supported by volume for confirmation. Stay tuned for updates as this setup unfolds!
I keep my charts clean and simple because I believe clarity leads to better decisions.
My approach is built on years of experience and a solid track record. I don’t claim to know it all, but I’m confident in my ability to spot high-probability setups.
My Previous Analysis
🐶 DOGEUSDT.P: Next Move
🎨 RENDERUSDT.P: Opportunity of the Month
💎 ETHUSDT.P: Where to Retrace
🟢 BNBUSDT.P: Potential Surge
📊 BTC Dominance: Reaction Zone
🌊 WAVESUSDT.P: Demand Zone Potential
🟣 UNIUSDT.P: Long-Term Trade
🔵 XRPUSDT.P: Entry Zones
🔗 LINKUSDT.P: Follow The River
📈 BTCUSDT.P: Two Key Demand Zones
🟩 POLUSDT: Bullish Momentum
🌟 PENDLEUSDT.P: Where Opportunity Meets Precision
🔥 BTCUSDT.P: Liquidation of Highly Leveraged Longs
🌊 SOLUSDT.P: SOL's Dip - Your Opportunity
🐸 1000PEPEUSDT.P: Prime Bounce Zone Unlocked
🚀 ETHUSDT.P: Set to Explode - Don't Miss This Game Changer
🤖 IQUSDT: Smart Plan
⚡️ PONDUSDT: A Trade Not Taken Is Better Than a Losing One
💼 STMXUSDT: 2 Buying Areas
🐢 TURBOUSDT: Buy Zones and Buyer Presence
🌍 ICPUSDT.P: Massive Upside Potential | Check the Trade Update For Seeing Results
🟠 IDEXUSDT: Spot Buy Area | %26 Profit if You Trade with MSB
📌 USUALUSDT: Buyers Are Active

$Qireclaim of 200 ema retest happening
rsi curled up reclaim yellow line and teleport
targets above likely depending on how much juice it has

The Price Is About To Breakdown The Support 👉 There Is No Bullish Sign At Current level And In My Idea The Price Is About To Breakdown The 0.0103$ Level Toward a 0.0083$ As a Next Major Support Level

Trade Signal Alert: QIUSDT MovementAttention traders! We have a new trading signal for the QIUSDT pair. According to the analysis from our cutting-edge strategy, EASY Quantum Ai, a buying opportunity has emerged.
Direction: Buy
Enter Price: 0.0149
Take Profit: 0.01518333
Stop Loss: 0.01453333
Our forecast is based on a combination of technical indicators and market trends analyzed by the EASY Quantum Ai strategy. This approach takes into account historical price patterns, momentum shifts, and recent market sentiment to identify potential profit opportunities in the QIUSDT pair.
Several factors support this prediction:
- Momentum Indicator: The pair shows strong momentum suggesting a continued upward move.
- Market Sentiment: Recent news and developments related to QI suggest a positive market outlook.
- Pattern Analysis: Historical pattern matching indicates a potential rise towards the target level.
Please ensure you manage your risk effectively. Set your take profit and stop loss as indicated to maximize gains and minimize potential losses. Happy trading!

QI long📉 BUY: QIUSDT
📌 Entry Point: 0.015
⛔️ Stop-Loss: 0.0105 (30.0%)
🎯 Take-Profit #1: 0.029 (93.3%)
🎯 Take-Profit #2: 0.043 (186.7%)
🎯 Take-Profit #3: 0.073 (386.7%)
Risk 3%

Trading opportunity for QIUSDTBased on technical factors there is a Buy position in :
📊 QIUSDT
🔵 Buy Now
🪫Stop loss 0.01250
🔋Target 1 0.01760
🔋Target 2 0.02050
🔋Target 3 0.02400
💸RISK : 1%
We hope it is profitable for you ❤️
Please support our activity with your likes👍 and comments📝

QIUSDT - Daily Shortterm Trend & Support/Resistence Trade SignalQIUSDT now completed a correction and are ready to return to gain higher.
The new opportunity at the current price
🟢 Trend: Bullish 🚀
🟢 Support: $ 0.0136
🟢 Target: $ 0.4
------
Current: $ 0.0208

Establish a trading strategy that suits your investment styleHello traders!
If you "Follow" us, you can always get new information quickly.
Please also click “Boost”.
Have a good day.
-------------------------------------
(QIUSDT 1M chart)
The key is whether it can receive support and rise around 0.01550-0.01939.
If not, it is highly likely that the flow is to create a middle section in the form of a bottom.
(1W chart)
Since the HA-High indicator is formed at the 0.02464 point, it is highly likely that the price will continue its upward trend if it rises above 0.02464 and maintains the price.
However, since a psychological volume profile section has been formed up to the 0.03732 point, a full-fledged upward trend is expected to begin only when it rises above this point.
If it falls below 0.01550 and shows resistance, it is likely to fall near the HA-Low indicator.
Currently, the HA-Low indicator is formed at 0.00736.
However, as the price falls, there is a possibility that a new HA-Low indicator will be created, so support near the HA-Low indicator is important.
(1D chart)
The HA-Low indicator is formed at 0.01560.
Accordingly, the key is whether it can receive support and rise in the important area around 0.01550-0.01939.
If the price falls below the HA-Low indicator and shows resistance, there is a high possibility of a cascading decline, so a countermeasure is needed.
Since a volume profile section is formed at the 0.0122 point, you need to check whether you can receive support around this area.
The HA-High indicator is formed at 0.02715.
Since the HA-High indicator on the 1W chart is formed at the 0.02464 point, the 0.02464-0.02715 section is likely to be a resistance zone.
If it receives support in the 0.02464-0.02715 range and rises, it is likely that an upward trend will begin.
However, since the 0.03549-0.03732 section may again serve as a resistance section, a countermeasure is needed.
-------------------------------------------------- ----
To trade by looking at this chart, you need to choose what is most important to you and decide on an appropriate investment period.
If the investment period does not suit your investment style, it is better not to trade.
The reason is that once you start trading, your psychological influence is likely to have a big impact on your trading.
In day trading or short-term trading, it is recommended to buy when support is confirmed in the 0.01550-0.01939 range and sell around 0.02464-0.02715, the first split selling range.
At this time, you must decide whether to sell 100% and receive a cash profit, or whether to sell the purchase principal amount and leave the number of coins (tokens) corresponding to the profit.
For medium to long term trading, I don't think it's time to trade yet.
The reason is that, as mentioned earlier, if it falls below 0.01550-0.01939, there is a high possibility of creating an intermediate section in the form of a bottom.
Therefore, it is recommended to proceed with a split purchase when support appears near the HA-Low indicator of the 1M chart or the HA-Low indicator of the 1W chart.
Therefore, it is most important to create a trading strategy that suits your investment style.
1. Investment period
2. Investment size
3. Trading method and profit realization method
You need to create a trading strategy based on 1-3 above.
Numbers 1 and 2 are to determine the investment period and investment size according to your investment style, so you can make your decision by analyzing charts and checking other coin ecosystems.
Number 3 is to decide on the detailed trading method when you decide to trade, so you must select the buying, selling, and stop-loss method and decide how to realize profits accordingly.
It is useful when conducting mid- to long-term transactions to reserve the number of coins (tokens) corresponding to profit rather than 100% selling.
This is because the purchase price of the coin (token) corresponding to profit is 0.
Have a good time.
thank you
--------------------------------------------------
- The big picture
A full-fledged upward trend is expected to begin when the price rises above 29K.
This is the section expected to be touched in the next bull market, 81K-95K.
#BTCUSD 12M
1st: 44234.54
2nd: 61383.23
3rd: 89126.41
101875.70-106275.10 (when overshooting)
4th: 13401.28
151166.97-157451.83 (when overshooting)
5th: 178910.15
These are points that are likely to encounter resistance in the future.
We need to see if we can break through these points upward.
Since it is thought that a new trend can be created in the overshooting zone, you should check the movement when this zone is touched.
#BTCUSD 1M
If the general upward trend continues until 2025, it is expected to rise to around 57014.33 and then create a pull back pattern.
1st: 43833.05
2nd: 32992.55
-----------------

QIUSDT(Benqi) Daily tf Range Updated till 11-05-24QIUSDT(Benqi) Daily timeframe range. another alt trying for a retrace back. 0.02191 holding for now, not much retail interest. if it comes later maybe get over 0.02191 clean which will open its way till 0.03030. but that will require a healthy daily close.

BENQI (QI)BENQI is a decentralized noncustodial liquidity market as well as a liquid staking protocol built on the high-speed Avalanche smart contract network. The lending protocol allows users to lend, borrow, or earn interest using their digital assets. The Liquid Staking protocol provides a solution for capital efficiency, offering users the opportunity to unlock their staked AVAX to be used on Decentralized Financial protocols.
Anyway, the QI start was not bad, considering it went into a long downtrend afterward. Then QI broke the major downtrend line and then tried to make a reversal, which was successful when it broke the first minor horizontal area upward. QI went up, and now it seems oscillating in a big rectangular consolidation area (or some call it a sideways channel). Currently, at the bottom of this area and trying to start the next upward phase. Let's see if QI can break this area and reach the next horizontal resistance area.

Expect a New Bullish Rally Soon👉 At Lowe Timeframe There Is a Clear Bull Flag Formed At The Chart Which The Price Exactly Bounced From The 1.272% PRZ Also At The Higher Time Frame There Is a Falling Wedge
📈 I Expect a The Price Breakout From The Bull Flag Toward a 0.03$ Then Breakout From The Falling Wedge Toward a 0.036$ And 0.048$

$QInot in this posting it as a request
flipping yellow line pretty soon then massive zone ahead and this bubba loves wicks
avax looking solid so this shall melt faces soon

QI NEW INCREASE VOLUME QI seems to have entered an important level where it could get a new break volume.
We will follow the trend for new daily volume.

QI analysisIt seems to be at the end of a triangle.
By maintaining the green range, the triangle can be completed and we can see another pump.
The targets are clear on the chart.
Closing a daily candle below the invalidation level will violate the analysis
For risk management, please don't forget stop loss and capital management
When we reach the first target, save some profit and then change the stop to entry
Comment if you have any questions
Thank You

QI/USDT is on fire!!!Its AVAX season and Benqi is a top choice for me!
Can it get its previous ATH???
I believe Qi has been in an accumulation zone for a long long time and if it comes above 0.045 it's ready to fly!!!!!
Btw #DYOR

#BENQI UPDATE#BENQI
It seems that soon he can break the weekly time with his strength
If it breaks and stabilizes, it can grow at least 800%
Now is the best time to buy cheap
Except for the #AVAX network


QIUSDT - thesis it will recoil then follow an upward trajectoryIn the current market it is likely to be highly volatile. Holders could be rewarded with an all time high after a few recoils. Looking bullish but not much talked about coin. Let's see how it behaves over the next few days or weeks.
