QKCUSDT Forming Bullish PennantQKCUSDT is exhibiting a bullish pennant pattern, a highly regarded continuation formation that signals the potential for another significant upward move following its previous bullish momentum. This pattern typically reflects a brief consolidation period where price action narrows before a breakout
Related pairs

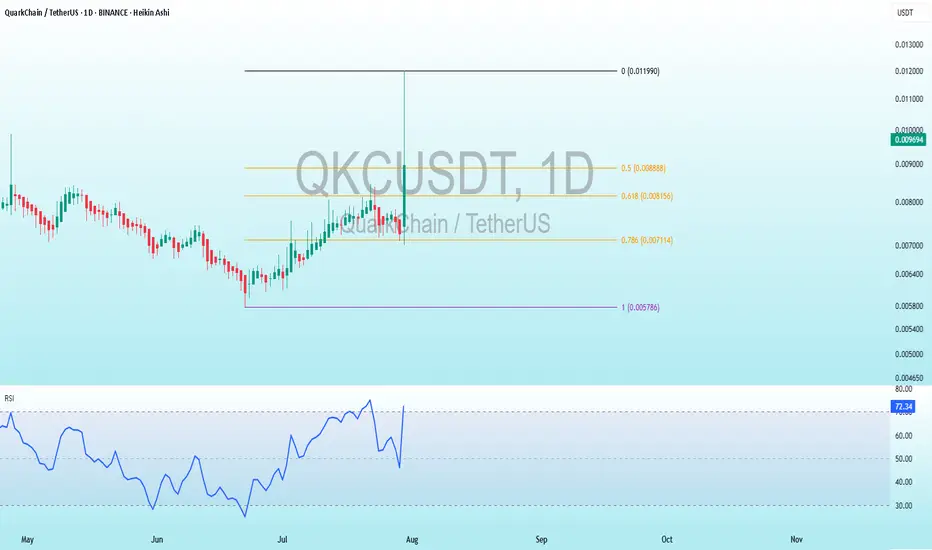
QKC Bearish DivergenceBINANCE:QKCUSDT
Trade Setup:
Target 1: 0.008888 (0.5 Fibonnaci Golden Zone).
Target 2: 0.008156 (0.618 Fibonnaci Golden Zone).
Target 3: 0.007114 (0.786 Fibonnaci Golden Zone).
Target 4: 0.005786 (1 Fibonnaci).
Stop Loss: 0.011990 (0 Fibonnaci).
RSI Analysis: The RSI is showing a bullish diverg
QKCUSDT – Order Flow Confirmations Support a Short BiasIn my latest QKCUSDT analysis I gave you the best zone possible!
Following the current order flow and market data, my bias on QKCUSDT remains short. The analysis consistently shows that this coin is under selling pressure, and the ideal entry area for shorts is centered around the blue box. Howev

QKCUSDT | Critical Resistance Zone IdentifiedThe red box is a strong resistance zone where sellers are likely to step in. This is not a random level—it’s carefully identified based on key market dynamics.
🔴 Short Scenario – Rejection From Resistance
✔️ If the price struggles here, I will look for lower time frame (LTF) breakdowns for a short


QKC/USDT - Ascending Triangle Breakout with 20% Target TECHNICAL ANALYSIS: 📈
Price Structure:
- QuarkChain currently showing a clear ascending triangle pattern
- Current price: $0.01036 (-1.57%)
- Trading timeframe: 1H chart
- Key price level identified at $0.012(potential 20% upside)
Pattern Analysis:
- Formation of an ascending triangle with:
• Ho

QKCUSDT: Massive Volume is ComingDaily Volume: The daily trading volume of QKCUSDT has surged by 105%. Despite this significant increase, buyers remain inactive.
Key Points:
Blue Boxes: Highlight potential areas where buyers may become active.
Stop Areas: Marked with red line.
Conclusion: While the volume increase is a positive

Prepare to BUY Spot QKCUSDT on the D1 Cycle
🌟 Get Ready for the Next Big Move with QKCUSDT! 🌟
🌍 Market Overview:
QKCUSDT is showing strong bullish potential on the D1 timeframe, presenting an excellent opportunity for short-term gains.
📊 Trade Plan:
📌 Entry: $0.009 - $0.011 – Key range for accumulation before the breakout.
🎯 Target: x2

QKC/USDT- BUY SETUPBINANCE:QKCUSDT
✔︎ENTRY : 0.012604
🏓TARGETS :
✔︎T1 : 0.012604
✔︎T2 : 0.013253
✔︎T3 : 0.015140
💡Reason for this trade:
This trade gives my trading system a sign of strength:
• My trading system is based on liquidity and reversal zones.
• When the liquidity is swept from one side under certain co

QuarkChain | What Comes Quickly, Goes QuicklyI know it's way down, but what comes quickly, goes quickly. This is my buying zone for QKC.
Since it can be included as a spot, I did not specify a clear place where the stop order should be, but to give you an idea, if we fall below $ 0.010520, it will come even lower.

See all ideas
Summarizing what the indicators are suggesting.
Oscillators
Neutral
SellBuy
Strong sellStrong buy
Strong sellSellNeutralBuyStrong buy
Oscillators
Neutral
SellBuy
Strong sellStrong buy
Strong sellSellNeutralBuyStrong buy
Summary
Neutral
SellBuy
Strong sellStrong buy
Strong sellSellNeutralBuyStrong buy
Summary
Neutral
SellBuy
Strong sellStrong buy
Strong sellSellNeutralBuyStrong buy
Summary
Neutral
SellBuy
Strong sellStrong buy
Strong sellSellNeutralBuyStrong buy
Moving Averages
Neutral
SellBuy
Strong sellStrong buy
Strong sellSellNeutralBuyStrong buy
Moving Averages
Neutral
SellBuy
Strong sellStrong buy
Strong sellSellNeutralBuyStrong buy
Displays a symbol's price movements over previous years to identify recurring trends.
Frequently Asked Questions
The current price of QuarkChain / TetherUS (QKC) is 0.007377 USDT — it has fallen −0.14% in the past 24 hours. Try placing this info into the context by checking out what coins are also gaining and losing at the moment and seeing QKC price chart.
QuarkChain / TetherUS price has fallen by −10.37% over the last week, its month performance shows a 5.62% increase, and as for the last year, QuarkChain / TetherUS has increased by 17.77%. See more dynamics on QKC price chart.
Keep track of coins' changes with our Crypto Coins Heatmap.
Keep track of coins' changes with our Crypto Coins Heatmap.
QuarkChain / TetherUS (QKC) reached its highest price on Mar 12, 2024 — it amounted to 0.021500 USDT. Find more insights on the QKC price chart.
See the list of crypto gainers and choose what best fits your strategy.
See the list of crypto gainers and choose what best fits your strategy.
QuarkChain / TetherUS (QKC) reached the lowest price of 0.005138 USDT on Apr 7, 2025. View more QuarkChain / TetherUS dynamics on the price chart.
See the list of crypto losers to find unexpected opportunities.
See the list of crypto losers to find unexpected opportunities.
The safest choice when buying QKC is to go to a well-known crypto exchange. Some of the popular names are Binance, Coinbase, Kraken. But you'll have to find a reliable broker and create an account first. You can trade QKC right from TradingView charts — just choose a broker and connect to your account.
Crypto markets are famous for their volatility, so one should study all the available stats before adding crypto assets to their portfolio. Very often it's technical analysis that comes in handy. We prepared technical ratings for QuarkChain / TetherUS (QKC): today its technical analysis shows the sell signal, and according to the 1 week rating QKC shows the sell signal. And you'd better dig deeper and study 1 month rating too — it's sell. Find inspiration in QuarkChain / TetherUS trading ideas and keep track of what's moving crypto markets with our crypto news feed.
QuarkChain / TetherUS (QKC) is just as reliable as any other crypto asset — this corner of the world market is highly volatile. Today, for instance, QuarkChain / TetherUS is estimated as 2.42% volatile. The only thing it means is that you must prepare and examine all available information before making a decision. And if you're not sure about QuarkChain / TetherUS, you can find more inspiration in our curated watchlists.
You can discuss QuarkChain / TetherUS (QKC) with other users in our public chats, Minds or in the comments to Ideas.