QNT/USDT 15m SETUP.QNT/USDT 15m Setup 🔥
Price made a strong Change of Character (ChoCH) to the upside, confirming bullish intent.
After the shift, price rallied and created a clean Demand Zone around $117.80–$118.50.
✅ Now waiting for a potential pullback to this zone for a high-probability long entry.
SMC-based
Related pairs

$QNT LOOKS GOOD TO LONG!GETTEX:QNT
Price is pulling back after a strong move up and is currently testing the trendline support along with key Fibonacci levels. This area has acted as a demand zone previously, making it a potential bounce spot for continuation.
If the trendline and Fib zone hold, we could see the next le

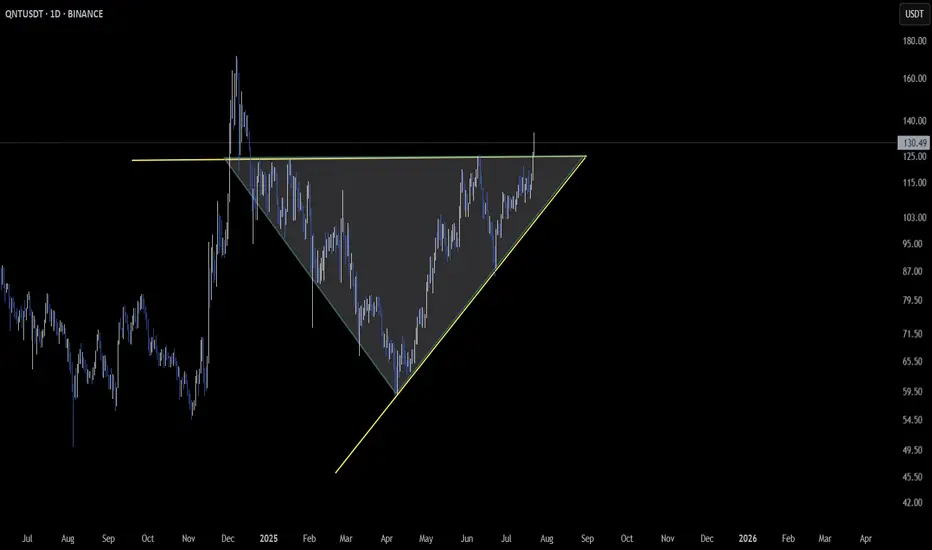
QNTUSDT 1D#QNT has officially broken out of the symmetrical triangle on the daily chart, flipping all major moving averages into support. With RSI in the overbought zone, caution is key — but momentum is strong. The ideal entry is on a pullback to the support zone around $121.00–$117.61. If the breakout holds

Market Update + QNT Analysis
🔍 Market Update + QNT Analysis
📊 General Market Conditions:
1. TOTAL / TOTAL2 / TOTAL3
🚫 Rejected from the top
❗Didn't touch the previous bottom
👉 Buyers are weak, but sellers not in control either → Market is in a wait-and-see (range) mode.
2. Others.d
🔻 Breaking below previous support

$QNT Breaks Out of Cup & Handle, $245 in Sight?GETTEX:QNT Update (Quant)
Quant has just broken out of a textbook cup and handle pattern on the daily chart, a bullish structure that often signals the start of a strong move.
The neckline resistance near $124 has been breached with solid momentum.
If the breakout holds on a daily candle close,

$QNTUSDT Breakout – 120% Move Ahead?GETTEX:QNT just broke out of a major triangle pattern that’s been building for months.
With this breakout above $121, the chart hints at a strong move ahead, possibly up to $260.
If it holds above the $108 zone, this could be the start of a big rally. One to watch closely.
DYOR, NFA

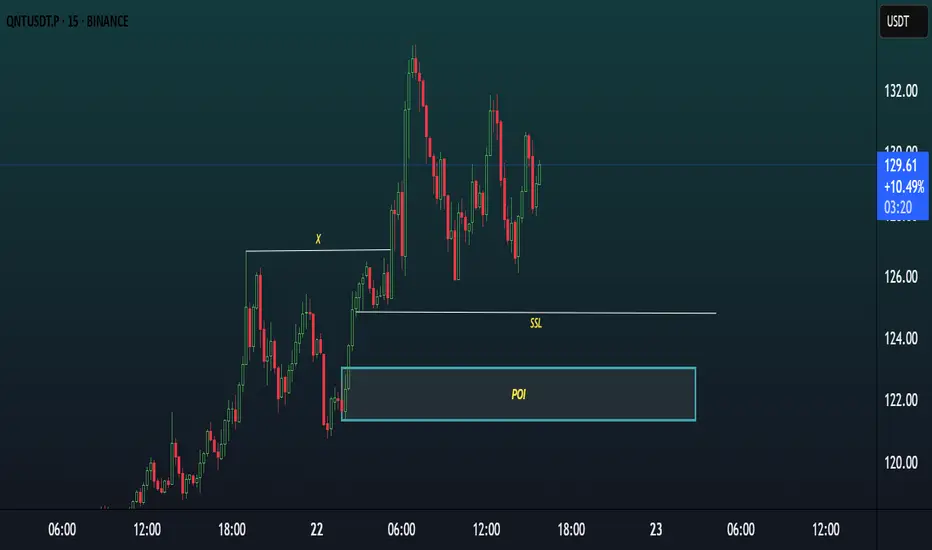
QNT TRADE IDEA.Market Structure: The market broke previous highs, showing bullish intent. A temporary pullback is underway, forming a higher low structure.
Liquidity Setup: There is a clear Sell-Side Liquidity (SSL) resting below recent lows around $124, acting as a liquidity magnet. Price may move down to collec
QNT Breaking Out of Key Triangle StructureQNT is stepping into the spotlight with a breakout from an ascending triangle on the daily chart 📈. This pattern is typically a bullish continuation setup, and the current move suggests that momentum is picking up speed ⚡.
If the breakout sustains, it could lead to a sharper acceleration toward hig
QNT Waking Up? The Sleeping Giant Eyes $160+Summary
Quant (QNT) remains in a multi-year accumulation range" since its 2021 cycle top. The asset shows textbook signs of liquidity engineering, and the next decisive move hinges on structural breaks above key price levels. Institutional momentum is quietly building beneath the surface, supporte

QNT/USDT - massive boxQNT/USDT is printing one of the most classic textbook patterns a massive box range that has developed over the past 1000 days. This type of long-term consolidation typically leads to explosive moves once the breakout occurs, and historically, box patterns of this scale rarely fail when confirmed.

See all ideas
Summarizing what the indicators are suggesting.
Oscillators
Neutral
SellBuy
Strong sellStrong buy
Strong sellSellNeutralBuyStrong buy
Oscillators
Neutral
SellBuy
Strong sellStrong buy
Strong sellSellNeutralBuyStrong buy
Summary
Neutral
SellBuy
Strong sellStrong buy
Strong sellSellNeutralBuyStrong buy
Summary
Neutral
SellBuy
Strong sellStrong buy
Strong sellSellNeutralBuyStrong buy
Summary
Neutral
SellBuy
Strong sellStrong buy
Strong sellSellNeutralBuyStrong buy
Moving Averages
Neutral
SellBuy
Strong sellStrong buy
Strong sellSellNeutralBuyStrong buy
Moving Averages
Neutral
SellBuy
Strong sellStrong buy
Strong sellSellNeutralBuyStrong buy
Displays a symbol's price movements over previous years to identify recurring trends.
Curated watchlists where QNTUSDT is featured.

Interoperability Crypto: Communication station
14 No. of Symbols
See all sparks
Frequently Asked Questions
The current price of QNT / TetherUS (QNT) is 106.74 USDT — it has fallen −1.95% in the past 24 hours. Try placing this info into the context by checking out what coins are also gaining and losing at the moment and seeing QNT price chart.
QNT / TetherUS price has fallen by −10.31% over the last week, its month performance shows a −0.79% decrease, and as for the last year, QNT / TetherUS has increased by 54.03%. See more dynamics on QNT price chart.
Keep track of coins' changes with our Crypto Coins Heatmap.
Keep track of coins' changes with our Crypto Coins Heatmap.
QNT / TetherUS (QNT) reached its highest price on Sep 11, 2021 — it amounted to 430.00 USDT. Find more insights on the QNT price chart.
See the list of crypto gainers and choose what best fits your strategy.
See the list of crypto gainers and choose what best fits your strategy.
QNT / TetherUS (QNT) reached the lowest price of 40.10 USDT on Jun 13, 2022. View more QNT / TetherUS dynamics on the price chart.
See the list of crypto losers to find unexpected opportunities.
See the list of crypto losers to find unexpected opportunities.
The safest choice when buying QNT is to go to a well-known crypto exchange. Some of the popular names are Binance, Coinbase, Kraken. But you'll have to find a reliable broker and create an account first. You can trade QNT right from TradingView charts — just choose a broker and connect to your account.
Crypto markets are famous for their volatility, so one should study all the available stats before adding crypto assets to their portfolio. Very often it's technical analysis that comes in handy. We prepared technical ratings for QNT / TetherUS (QNT): today its technical analysis shows the sell signal, and according to the 1 week rating QNT shows the buy signal. And you'd better dig deeper and study 1 month rating too — it's buy. Find inspiration in QNT / TetherUS trading ideas and keep track of what's moving crypto markets with our crypto news feed.
QNT / TetherUS (QNT) is just as reliable as any other crypto asset — this corner of the world market is highly volatile. Today, for instance, QNT / TetherUS is estimated as 5.75% volatile. The only thing it means is that you must prepare and examine all available information before making a decision. And if you're not sure about QNT / TetherUS, you can find more inspiration in our curated watchlists.
You can discuss QNT / TetherUS (QNT) with other users in our public chats, Minds or in the comments to Ideas.