QNTUSDT London-based Quant Network is set to revolutionise blockchain technology with the development of their blockchain operating system Overledger. The experienced team are determined to fulfil the original vision of the internet by creating an open trusted network for people, machines, and data to operate securely and safely.
Overledger -the first interoperable blockchain operating system that facilitates internet-scale development of decentralised, multi-chain applications. Overledger has the ability to unlock and distribute value and applications across current and future blockchains. It is an agnostic platform that connects the world's networks to blockchains and ensures you're not limited to any single a vendor or technology. Overledger is the only platform that facilitates the development of internet-scales development of decentralised, multi-chain applications.
QNTUSDT trade ideas

viewpoint Short For QNTHi, dear traders. how are you ? Today we have a viewpoint to SELL/SHORT the QNT symbol.
For risk management, please don't forget stop loss and capital management
When we reach the first target, save some profit and then change the stop to entry
Comment if you have any questions
Thank You

Quant longQuant broke trough off the upper boundary of descending channel. Asset broke trough the resistance level. Bullish movement to resistance level at 131 is expected to happen.

QNTIdea: The price is trying to break through the upper border of the descending triangle. The price will drop to the lower border of the pattern and break it if it bounces off the upper border. Bullish scenario will push the price to 200 EMA

I see BLOOD for #QNT #Quant.Holding on to my disbelief that this asset will have a strong support and finally meet the point of interest where we all were not able to get in.
I am only reminding myself to start buying arount 70 and 62$ at least.
Hoping that I have enough money to get in here and thank you myself for seeing this wonderful opportunity.
QNT is something we can see to fly 3 digits around 400$ like price action of EGOLD or EGLD.
I am just talking to myself and doing this for records and say I TOLD YOU SO MYSELF.

QNT : Day trade volumeQNT on Day trading seems to enter some important trend.
Interesting to see if this coin is able to get some confirmations on the day trading frame.

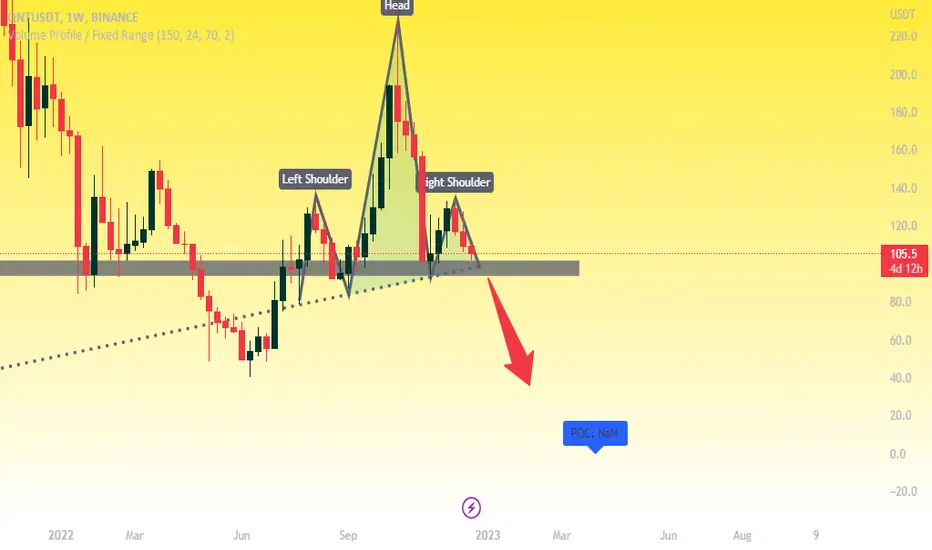
QNT CURRENTI think there is a shoulder head and shoulder formation in qnt and there is a negative dissonance in volume in terms of tangent, there is also a bearish retest image of rsi. I am predicting a strong decline in the coming days.

this is my opinion about Quant hello guys
we have a very good opportunity for BTC long position
it is mostly a long position and you can martingale in this position
all you need to know is in the chart
good luck
The information provided on this Page does not constitute investment advice, financial advice, trading advice, or any other sort of advice and you should not treat any of the website's content as such. this page does not recommend that any cryptocurrency should be bought, sold, or held by you. Do conduct your own due diligence and consult your financial advisor before making any investment decisions

QNTUSDT WEEKLY QntUsdt weekly time frame bearish head and shoulder so short now and get profit in coming of days
QNTUSDT 1W Interval Targets and StoplossHello everyone, let's take a look at the 1W QNT to USDT chart as you can see that the price is moving below the downtrend line and is close to exiting the current triangle.
Let's start by setting goals for the near future that we can take into account:
T1 = $127.6
T2 = $148.7
T3 = $165.8
and
T4 = $182.5
Now let's move on to the stop loss in case the market goes down further:
SL1 = $102.6
SL2 = $82.6
SL3 = $66.4
and
SL4 = $50.8
Looking at the CHOP indicator, we see that the energy is gaining strength on the 1W interval, while the MACD indicator confirms the downward trend, but with a decreasing advantage of sellers.

QNT_USDTDaily time frame
The trading range is formed between the two prices of $99 and $129.5.
But due to the downward trend of the market, don't rush to buy. And if we have a break of the $99 support, the $80 and $63 range are good prices to buy...
like comment

QNTUSDT | PARALLEL CHANNELQNT has been trading in a bullish parallel channel . The price is making higher highs and higher lows.
Currently it is trading at lower boundary of channel.
The bulls need to hold the lower boundary of channel. While bears will get active in this zone
Trade your levels accordingly.

QNT ANALYSIS (1H)Hi, I hope you are well
For this symbol, I identified a diametric, and I think its wave f is a triangle. At the end of wave e, you can buy towards the announced targets

Quant #qnt short termQuant could fall to $90 in the short term but by mid 2023 we could see price break about $280

$QNT to 109$ USD?I have found a Rising Wedge in the QNT/USDT
Wait for the break of the Rising wedge to enter short
TARGETS:
1️⃣118.3🎯
2️⃣113.8🎯
3️⃣109.2🎯
4️⃣102.7🎯

🔥 QNT Bounce From SupportQNT has seemingly bounced from the bottom support for the 5th time. I'm waiting for a confirmed break out through the yellow dotted line before considering an entry.
Targets placed at the blue lines.

QNT (Y22.P4.Video1).Fractal and macro overviewHi Traders,
#QUANT #Crypto
We found a fractal that can give reason to why we should be shorting from here.
All the best,
S.SAri

QuantOver the past six months, when the crypto market was still looking for its bottom, QUANT has already begun to pick up its growing trend. And during this period did 4X! Now the asset has made a deep correction and is starting to gain height again. In a clear trend. On the chart, we see a cup and handle pattern. Which showed us the lower level and made a rebound. Therefore, I think that at this stage, you can safely enter a growth position.

🟪 #QNT/USDTPERP - Potential 8.7%🟪 #QNT/USDTPERP
Entry Conditinos:
- Local Trendline breakout
- Retest
- Longterm Trendline support
- Regression breakout
• 🐮 Strategy: Long
• ⎿ Target 2 : 129.96 174.6%
• ⎿ Target 1 : 124.53 83.8%
• 💰 Entry: 119.01 ⌁ 119.52
• 🚫 Stop: 114.35 (-86.6%)
Trade Strategy Insight:
Asset: QNTUSDT
Trades Reviewed - 10
Review Period: 20th October 2022
Risk:Reward - 2:1
Wins: 6
Stop-Losses: 2
No Entries: 1
Break-Even: 1
Win-Rate: 75%
Profitability: 1.25
- Win-Rate Excl. Break-Even & No-Entries
- ((Win x Reward) - ((Risk x Stop-Losses)) / No.Completed Trades = Profitability

Quant might be a good shortQuant might be a good short if it breaks the trend line. BTC still has a few days before any possible good news. We might see most alts including QNT to get deep into the liquidity zone before moving back again.

IS THIS THE LOCAL BOTTOMS FOR QNT?1. This area looks like a nice long "KEY" must hold
2. I dont like the recent high, its likely that will get taken out and push up to local resistance at $148

QNT USDT buying chart analysisQNT USDT buying chart analysis, opportunity for long on bigger timeframe

QNTUSDT | RESISTANCE BROKENQNTUSDT has broken above the strong horizontal resistance.
The price previously get multiple times rejection from same zone
The bulls need to hold above the breakout zone.
The bulls are in control.
Manage tour levels accordingly.
