QUANT Inverted H&SInverted H&S pattern evident
The right arm of the right shoulder is yet to form completely, which allows bullish potential
Bullish on this daily timeframe
QNTUSDT trade ideas


QNT, strong resistance, can we break out?Support line very strong, is it possible to break out?
Bitcoin continues to sink. Gets more and more difficult.


QNTUSDTW shared this idea with you
👀👀 17%🤑 right now
the price brok the yellow line
so if the candle close above it
buy buy

QNTUSDT - 1H - impulse completeAccording to this count a 5-wave impulse seems complete.
We can see a bearish divergence on indicator also.
I expect a retracement at least to 0.38 fib retracement.
Please like, share and follow.
Happy trading.

Nothing changed - 177.88$Check my previous idea after that
We are exactly at the mid level of the monthly open and our major resistance (heavy OB)
Personally i expect a retracement to the montly open and a rally up to 180$
I Have a sell order at 177.88$ my tp is 96$ 53$ and 22$
Tough week ahead especially at OCT 13
Macro still not looking good
Nuclear war heating up
Winter is here
Expect the unexpected

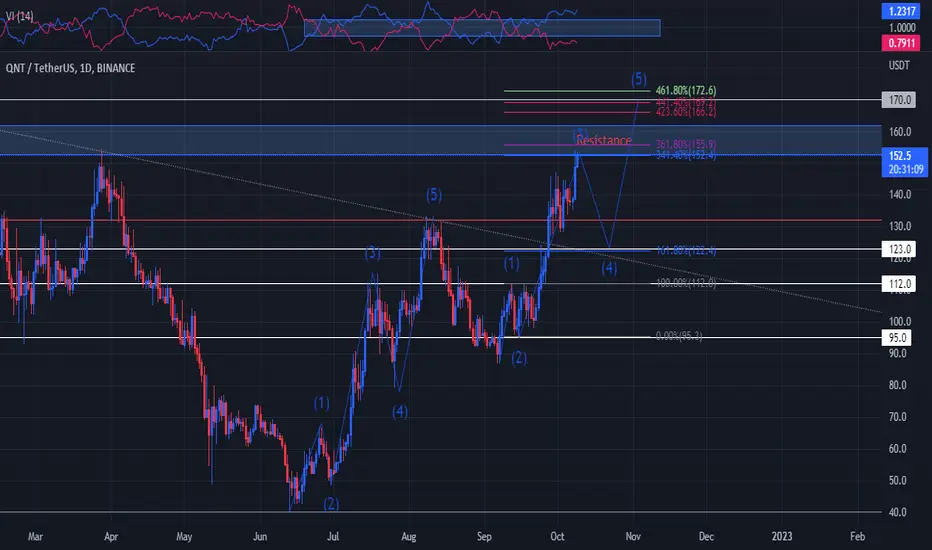
QNTUSDT Perfect Elliot WaveWill be a perfect elliot wave if we resist here, and then we correct to 4th wave
and then bounce to max. wave (5th wave)
Trade safely.
follow for updates
$QNT - Brewing Up for next HIGHHello my Fellow TraderZ,
On 4 HTF, $QNT #QUANT is forming an ASCENDING TRIANGLE which is bullish in nature. RSI has already broken the Trendline Resistance so waiting for the Price to do the same.
But be a bit cautious as multiple rejections near $142 is clearly showing the strength of the Sellers.
If breakout happens above $142 with strong VOLUME, go for LONG with the price target ~$160.
Trade well FAM. CHEERS!!!

Pressing on very strong resistanceNo position here but my buddy Arty tipped me on this movement.
I have to check the fundamentals but we see a wedge into this very very strong resistance area.
There is a potential trade incoming on shorter time frames - pretty risky to move on either way still but one for the watch list.

QNTUSDT | RESPECCTING SUPPORT??QNTUSDT has been in a bullish trend.
Currently, the price is trading near rising support which is well respected by price previously.
The bulls are in control as long as price is trading above rising support.
Bears will get control below break of rising support.
Trade your levels accordingly.

$QNTUSDT UPDATE!!!Hi Snipers,
Please refer to the recording for the next price levels and scenarios.
Thanks
MS

QNT DEMAND ZONEPatience for investors.
QNT demand zone given by several inefficiencies on price action.
I would say QNT will go to demand zone again by more than 70% of chances


QNTUSDT#QNTUSDT
(LONG SIGNAL)
(SWING TRADE )
MACD is showing bullish
EMAs showing a bullish move
RSI is neutral
the price broke down the powerful support in june 2022 and now we are in the correction action
if the price breakout the yellow line and close above it that good signal for a big move for QNTUSDT
targets set at the chart

QNTUSDT#QNTUSDT
(LONG SIGNAL)
(SWING TRADE )
the price broke down the powerful support in june 2022 and now we are in the correction action if the price breakout the yellow line and close above it that good signal for a big move for QNTUSDT


QNT - resistance is futile (for now)The way I see it with RSI hitting so high right around resistance, QNT will be heading back down again over the next few days. Good chance to load back up around the 112 range, if that fails to hold as support then we will go back to the 90's (great buying opportunity IMO).
QNT has been moving against BTC for quite some time - BTC on the verge of moving up which adds to the conviction of QNT starting to move down at the same time.
Short (short-term), but mega bullish long-term.

Quant inverse head and shoulder patternQuant on a brink of a huge breakout, if this bullish momentum continues, Quant could hit $240

$QNT - Inverse Head & Shoulder on the ChartHello my Fellow TraderZ,
In my analysis of $UNI/Usdt pair, I mentioned abou the $QNT as both are almost following the same pattern.
But here $QNT has already broken the neckline and I'm looking for the retest for making any fresh entries.
If the retest gets succesful, we will see the price climbing $206 mark within no time, else will see back to $70-87 range to test.
Happy Trading Fam. CHEERS!!!


