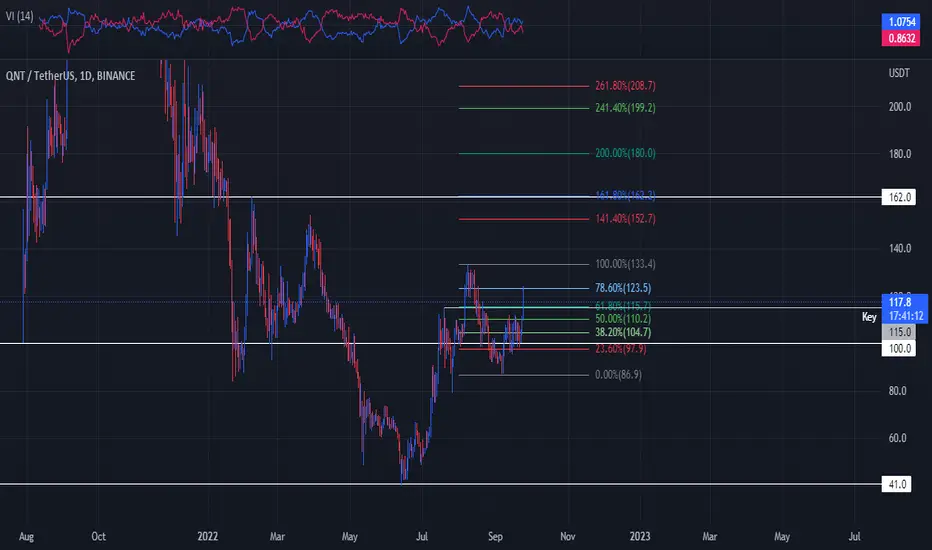
QNTUSDT | BULLISH PARALLEL CHANNELQNTUSDT has been trading in bullish parallel channel since formed a double bottom at 99.
The price is printing higher highs and higher lows.
The price has retraced to 0.382 fib level after made a top of 146.
The same level is also a horizontal support zone too.
The price has also respecting rising support.
Manage your trades accordingly.
QNTUSDT trade ideas


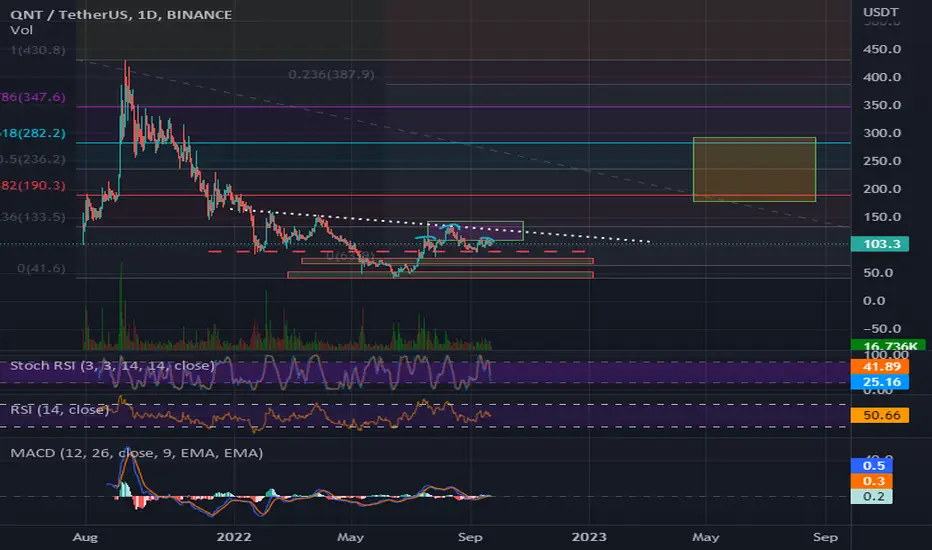
QNT in possibly Wyckoff distributionPossible end phase of the distribution, we want to check the price and see if it breaks the top line to go higher

BUY Quant $QNT Inverse Head & Shoulders Breakout, Bullish DailyBulls seem to be winning in a very bearish market when it comes to Quant $QNT.
The Inverse Head & Shoulders on the daily timeframe is a high-probability trade and one I have now entered and will continue to layer into. My targets are market on the chart at $189 - $222 for an easy 70%+ gain.
The pattern is one thing but what excites me about this play is the strong buy volume confirming these breakouts. Even on smaller timeframes like the 15 min, we are getting higher highs and higher lows with slowing volume into a price floor before the next breakout.
Social mentions + metrics are high as well if you check out LunarCrush.
All other factors/indicators aside, this is enough to convince me that taking a position wont be too risky.
Any breakdown below 120 at a serious timeframe will be my confirmation of a breakdown and I will exit at a small loss.

177,88$ Quant will pump until 177,88$ maybe not likely until 200$
Then they are going to sell and you are going to by
I expect another 82% drop to Quant,my target is on chart
I love Quant for the long term don't get me wrong
Just imho crypto winter has just started and these bear pumps confirms the above
I expect the unexpected

#QNT/USDT 1DAY UPDATE !!Hello dear traders, we here new so we ask you to support our ideas with your LIKE and COMMENT, also be free to ask any question in the comments, and we will try to answer for all, thank you, guys.
QNT UPDATE:-Quant (QNT)
Quant (QNT) rose to a six-month high on Wednesday, despite crypto markets mostly hovering in the red.
Following a low of $122.08 on Tuesday, QNT/USD rallied to a hump-day high of $143.26 earlier in the day.
The move came as prices raced past a key resistance point of $133.00, hitting their highest point since March 29 in the process.
Shortly after the breakout, we saw bears reenter the market, likely as a result of uncertainty spurred by earlier bulls who opted to close positions.
As of writing, quant is currently trading below the aforementioned resistance point, with the 14-day relative strength index (RSI) also hitting a ceiling.
Currently, the index is deep in overbought territory and tracking at 70.47. Should bulls aim to take the price higher, the ceiling of 71.00 on the RSI will need to be broken.
Sorry for my English it is not my native language.
Hit the like button if you like it and share your charts in the comments section.
Thank you

🔥 QNT Inverse Head & Shoulders: Bullish Move ExpectedSome time ago I made an analysis on QNT where I discussed the potential for an inverse head & shoulders pattern, which has now been confirmed by yesterday's break out.
In my view, it's likely that we're going to see further upside for QNT. Targets in blue. Be aware that the overall market is quite bearish at the moment, so manage your portfolio accordingly.

QNTUSDT(Quant) Daily tf Range Updated till 28-09-22QNTUSDT(Quant) Daily timeframe range. funny part is even with all the carnage going around within trading world, bleeding and fud and what not its still slowly moved up. its already up 200% from its june 2022 low. price action is less unstable we cant see much of unusual p and d. it got decent volume and a nice trading range.

QNT, Quant. Inverse head and shoulder.we will go higher and higher, provided bitcoin remains stable!


QNT, Inverse head and shoulder?inverse head and shoulder for QNT.
Hopefully this will happen if Bitcoin cooperates a bit.

QNTUSDT | CONVERGINGQNTUSDT has been trading under the resistance trendline. It is taking a hit from the falling trendline.
However, the price is still holding an important long rising support. Indicating converging of price and breakout is near.
Wait for the price to break above or below and take positions accordingly

Quant QNT big picture still goodIf Qnt breaks the $88 price range we may see $69 in the short term but long term we are still likly heading to the 0.382 or higher by mid 2023

Quant #QNT may reach about $180Quant #QNT may reach about $180, possibly even as high as $280 by mid 2023

QNTAssuming that the decline in cryptos will deepen with the interest increase to be taken at the fed meeting this week, I think that if it sags under the yellow trend in qnt, a classic obo formation will occur. I think that the current chart reflects this.

Pullback before Rally to 155On weekly chart
BINANCE:QNTUSDT has reached to 133 which level is the target of third wave.
It's trading around 108 and in the correction wave B.
Target of wave C around 77 - 73. After that, the fifth wave's a target at 155 or further.
Trade in lower timeframes
Let's wait and see


🔥 QNT Forming Inverse Head & Shoulders: Wait For ConfirmationQNT has seen some tremendous gains over the last couple of months. During the last dip QNT is potentially forming an inverse head & shoulders pattern. This pattern is classically a bullish reversal pattern, so that's what we're looking at today.
I'd advise to wait for a confirmed daily close above the neckline before entering a bullish position, especially with the rest of the market dumping hard. Patience is key. If the market continues to fall, QNT will likely follow, which will invalidate this trade.
Targets placed at the recent demand area between $175 and $200.

QNT could hit 73 USDMulti Timeframe Analysis
Hint: Markets overbought
QNT bucked the bearish trend of BTC and kept skyrocketing. Institutional buyers may commence a short term sell to lock in profits.
Medium term Bearish Narrative:
1. Bearish divergences on the daily chart
2. TDI signalling neutral, indecision zones
3. Money Flow Index still bearish
4. Bearish Cypher harmonic pattern on the daily chart.
Take Profit Short Sell Zones: 73 and 48
Remember: life often disrespects charts so trade with caution
------
Market order position upon the confluence of valid entry rules on the 4H or 1H chart.
-=ENTRY RULES=-
Trading philosophy: Don’t short at the lowest of the bearish momentum nor do we long at the peak of a bullish impulse. The safest entries are at the end of a retrace on the 38.2%, 50%, 61.8% or 78.6% fibonacci back in the direction of the master trend.
Note: I use Daily/4H or 4h/1H market structures with wave analysis to prep for potential entries. The RSI , MACD and EMA indictors are confirmation for entries at the 4H or 1H timeframe
For SHORT:
4H chart should confirm that the bullish retrace had turned bearish in the direction of master trend. The MACD should have dropped below zero signifying a bearish environment. Price would have dropped below the 10 and 20 EMA . For good measure, check that the 4h and D1 RSI is below the 50 signal line
For LONG:
4H chart should confirm that the bearish retrace had turned bullish in the direction of the master trend. The MACD should have gone above zero signifying a bullish environment. Price had gone above the 10 and 20 EMA . For good measure, check that the 4h and D1 RSI is above the 50 signal line
Divergences:
The 4H, 8H and 12H chart can reveal hidden divergences on the RSI , MACD , Money Flow Index, CMFI, On Balance Volume and Stochastics. When one or more divergences manifest- be ready. Trend reversal is coming. My best practice is to wait for at least an RSI divergence on the 4H, then drop to M15 to see price shifting with a 50EMA aligned with the 4H divergence.
About me
I am not a financial advisor nor a signal provider. These are the opinions of a 20-year private trader in the legal profession as well as a businessman diversified in the tech and hospitality industries. My favored tools of the trade include wave analysis, price action on the 4H to Weekly timeframes and institutional order flow ( COT data).

QNTThe price has broken the upper border of the falling wedge. The price must overcome the strong POC resistance level and the daily 50 MA for the uptrend to continue. Support and resistance levels indicated

#QNT short ideaHello dear Traders,
Here is my idea for #QNT
Price closed on daily chart below yellow trigger line (previous month low) - Trade active.
Targets marked in the chart (black lines)
Invalidation level marked with red line
Please feel free to ask any question in comments. I will try to answer all! Thank you
