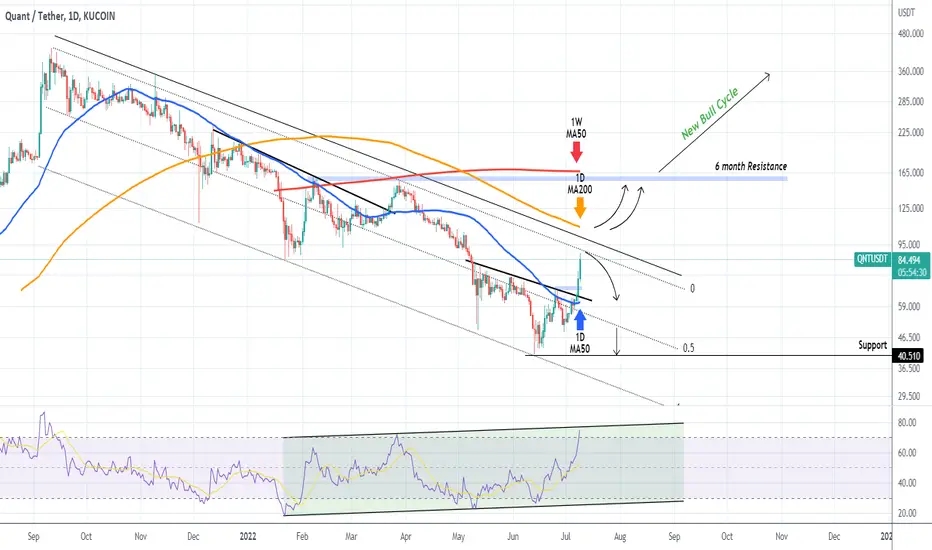
QNTUSDT strong 10 day rally approaching the 10 month Resistance*** ***
For this particular analysis on QUANT we are using the QNTUSDT symbol on the KuCoin exchange.
*** ***
The idea is on the 1D time-frame where QUANT has posted a 10 day rally since the June 30 low, having broken above the 1D MA50 (blue trend-line). The long-term trend since the September 11 2021 High is a Channel Down and today the price almost hit the Lower Highs (top) zone of this pattern. This has had clear rejections on March 28 2022 and November 09 2021 previously.
In our opinion we need to see a clear break above the Lower Highs trend-line, preferably above the 1D MA200 (orange trend-line) even, in order to leave behind this long-term bearish trend. The bias should turn completely bullish long-term if the price breaks above the 160.500 6 month Resistance, which is where the 1W MA50 (red trend-line) roughly is (also a Resistance since Feb 10). Until then, selling on a tight Lower High SL towards the 1D MA50 is a viable strategy.
It is worth noting though that the market is close to a long-term bottom as the 1D RSI has staged a Bullish Divergence, being on Higher Lows and Higher Highs since January 22.
--------------------------------------------------------------------------------------------------------
Please like, subscribe and share your ideas and charts with the community!
--------------------------------------------------------------------------------------------------------
QNTUSDT trade ideas
$QNT retests the 200 MA After the quad bounce off of the 0.786 resistance line yesterday (Larger Circle), the $QNT market headed towards a retest of the 200 MA (Smaller Circle). It was beautifully executed, both the 200 MA and the ichimoku cloud were touched, retested and successfully held their ground. The $QNT market is on its way up again following the uptrend line I had drawn a few days prior of buying what seemed to be the bottom of this run. Hopefully we can see some very nice profit over the next couple of days!
Thanks all for taking the time to view this idea! feel free to leave a comment and let me know if you agree with it or of there is anything I should consider on top of this information. I wish you good luck! <3

#QUANT $QNT with a HUGE breakout, what's next?BINANCE:QNTUSDT printed a good breakout on 4h timeframe
what's next? if we want to place a long position, we should look for a breakout confirmation: if the price is going to retest the 66$ former resistance area succesfully (printing a bullish candle afterwards), we can target the $87 weekly resistance, or something a little closer to the current price
if the scenario gets confirmed, these are the levels I'm watching:
TP: 80 (next resistance zone)
SL: 62 (just below the former resistance which should turn into new support)
let me know if you found this idea helpful and if you are going to enter the trade!
also dont forget to follow me, leave a like, and if you want to request a technical analysis , just comment the ticker of the cryptocurrency you want me to analyse down here!

$QNT bouncing off 0.786 Fib LineQuant went on a solid run as of yesterday and seems to be holding its support. it did bounce off the 0.786 Fib resistance line 3 times consecutively though.
not too sure on where to go from here if I sell and try get it cheaper or if I hold it to see if it does manage to break the resistance fib and continue on an uptrend. Ill keep you guys updated!
Thanks for reading! :)

$QNT - (Log chart) Getting down there soon. This is a follow up from my last (failed) idea on $QNT: It did not run independently this time. It failed to regain its EMA support and fell like the rest. But I do anticipate this coin will have one of the strongest runs in the next part of this cycle:
I see a WXY correction almost finishing and we can see there is some decent convergence support on the right side of the chart.
Let me know what you think.
Trade safe.
Quant shortQuant broke trough off the lower boundary of ascending channel. Asset broke trough the support level. Bearish movement to support level at 43 is expected to happen.

long QNT$QNT broke through the descending trendline and the resistance level. Bullish movement to resistance level at 64$ is likely to happen..

QNT breaking long resistance lineQNT has broken a long time resistance line, and there is a good indication of upwards pressure, let's hope it hits the two target zones.

Quant descending triangle short term 2022We have a descending triangle that is a bearish pattern. If this plays out we could see QNT at $48-$49. It would make sense if QNT plays out on a drop in price thus respecting this descending triangle pattern and we drop to the previous low, this would give us a double bottom and a healthy position for a rebound.
Quant ,after A,B,C correction i am optimistic for whats comes next
I am not sure the inv H&S we can see at RSI is important but i would love to see whats next

QUANTQNT is one of the strongest cryptos fundamentally IMO, QNT @ $70 is life changing but please DYOR (do your own research)

QNT/USDT
This Analysis will be updated ...
⚠️(DYOR)
If you apperciate my work , Please like and comment , It Keeps me motivated to do better

$QNT - THIS MIGHT BE HUGE! falling wedge, bullish div, retestshuge opportunity here on QUANT!
I love quant and its fundamentals so a trade opportunity on it really makes me want to enter asap to be honest
The price created a falling wedge in the past month, which is just about to breakout
the amplitude at the beginning of it was about 20%, so given the resistance around $115, we can expect a good 18%-ish rally until those prices if we see a strong breakout
ALSO, the price created a bullish RSI divergence, which historically almost always makes the price go up, and we might be seeing the start of the uptrend in just a few 4h candles, if not even on this one!
plus, we're approaching the huge $90 support level, which may mean something
BTC is also going to rally until 41 or 42 k in my opinion, so we might see some good momentum from quant
let me know what you think about this analysis and about the trade!
also drop a like and follow me here and on twitter if you enjoyed it!

QNT coming to lows again - prepare to buyBuy around ~$93
Sell target 1: ~$116 (fib 0.618)
Sell target 2: ~123 (fib 0.5)
QNT is reaching the resistance line, and also near the bottom at ~$89.
I expect lots of orders place at that zone. It will get volatile and pump for a little bit.

Quant QNT Price Targets and Stop LossQNT/USDT
Entry Range: $104 - 110
Take Profit 1: $127
Take Profit 2: $141
Take Profit 3: $171
Stop Loss: $91

Positive wedge formation on QNT 4hrThis wedge has found it's central horizontal support line above prior PA support, so this should break upwards.

QNTUSDT#QNT/USDT
strong and very important on in the interoperability project now its trading above strong/main demand zone. from here u can buy it !
this project hat future and its a real one!
I believe in its power.
BUY ORDER < 111
SELL ORDER >= 120
Targets on chart.
Love all of U!
if u like me trade style thank me in soomeee big like and follow me u big boss!

QNT USDT Long ????looking at qnt on the 18h seeing a nice doji at the bottom of this downtrend. hopefully getting ready for a 50% move to the upside . (would just be the start though ;)

Adam and Eve Elliot Wave count on QuantWhat you see here is a Adam and Eve patten with a Elliot Wave count.
3 Trade to be taken:
Wave: 2 Long:
Wait on entry below current price: $142 to take profit on around $187.
Wave 3 short:
This one will be a short because of the Grab Harmonic. This short is risky due the Adam and Eve pattern. Entry short should be around $190.
Wave 4: Long:
Wait for the pullback of wave 3 for a entry on around $160 and aim for the target 5 which could be around $200 - $216.
Wave 5: Short:
Between $200 - $216 is a big resistance. Together with the wave 5 confluence for a correction wave it's a good opportunity for a short trade. Target should be $160.
BINANCE:QNTUSDT

Quant longQuant bounced off the ascending trendline. Asset bounced off the support area. Bullish movement to resistance level at 145 is expected to happen.

$QNT king of interperoability BREAKOUTStill DCA-ing into this project
I set buy limit at zone $120-$130 waiting for pullback
Lets see how it plays

QNT - Video Top-Down Analysis!Hello TradingView Family / Fellow Traders. This is Richard, as known as theSignalyst.
Here is a detailed update top-down analysis for QNT.
Which scenario do you think is more likely to happen? and Why?
Always follow your trading plan regarding entry, risk management, and trade management.
Good Luck!
All Strategies Are Good; If Managed Properly!
~Rich

For all bullish QNT loversAfter that long phase of correction.
Qnt shows Adam and Eve.
In my opinion we reached the bottom and
have a solid entry point from here.
Target for this pattern 198 atleast.
Stay safe out there.
