QNT ANALYSIS🔮 #QNT Analysis
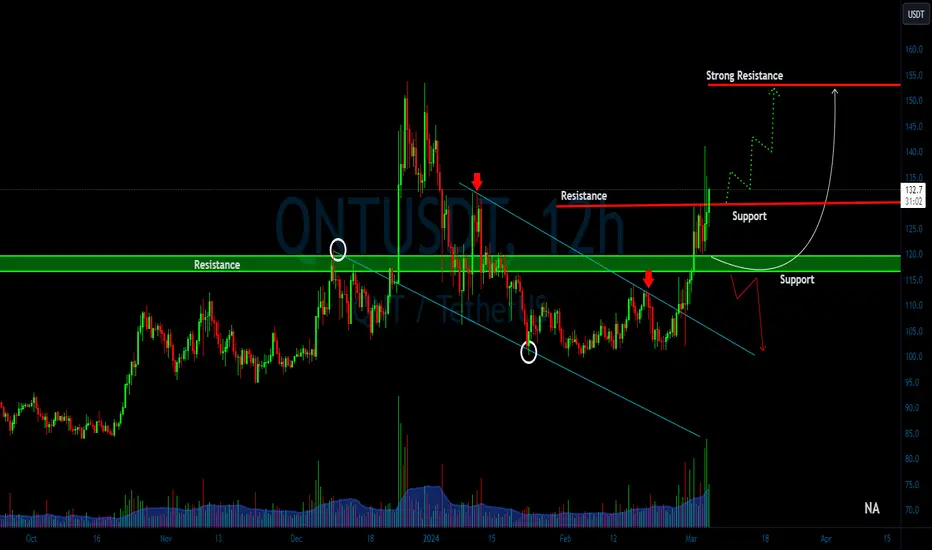
🌟As we said in our earlier post #QNT performed the same. Right now #QNT I'd trading in a falling wedge pattern in weekly time frame. Looking for a break out of the falling wedge🔥
🔖 Current Price: $128
⏳️ Target Price: $150
⁉️ What to do?
- We have marked crucial levels in the chart . We can trade according to the chart and make some profits. 🚀💸
#QNT #Cryptocurrency #Breakout #DYOR
QNTUSDT trade ideas

QNT/USDT upward momentum from key support? 👀 🚀 QNT💎 Paradisers, dive into the #QNTUSDT momentum, basking in bullish energy from its firm support base. After a minor hiccup at $129.5, #QNT is now embracing a pivotal shift at $152.9, transforming previous resistance into a platform for support. Staying anchored at this juncture could launch it on a bullish voyage, poised to surpass obstacles and venture into new realms.
💎 The crypto universe is known for its swift changes and surprises. Encountering resistance at this vital point suggests a possible need for strategy adjustment. Prepared for a bounce from the essential support at $117.2, yet aware that dropping below this marker could lead to bearish territories.
💎 Brace yourselves the #QNT journey is evolving, promising a ride filled with ups and downs. Secure your seatbelts, remain adaptable in your tactics, and stay alert for what's to come in this exhilarating saga.!
Quant - Quamfy 4th wave contracting triangleQuant
Quant and their Overledger are one of the biggest players in the blockchain world, however the majority are unaware of the importance this company and product have.
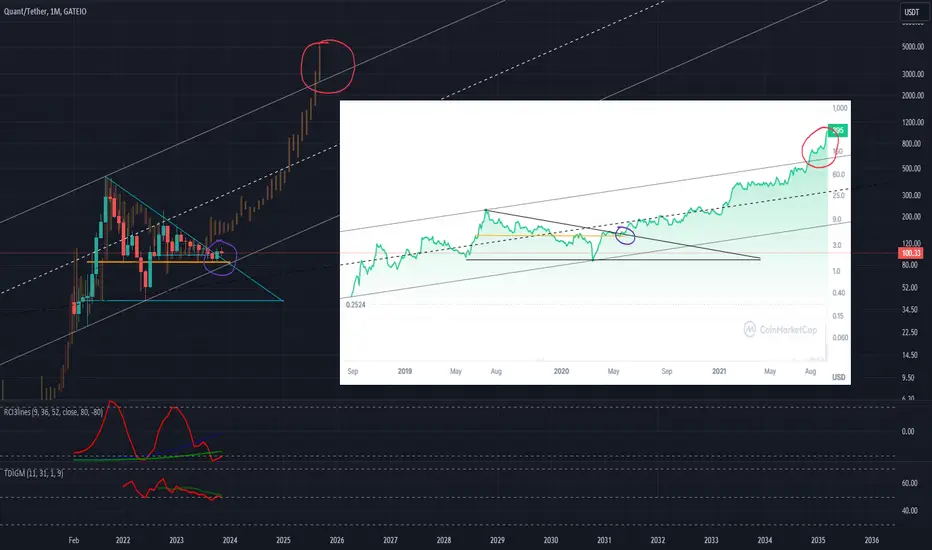
The Quant price (using coin trader pro), is in my opinion, currently in a wave 4 contracting triangle. This means that we are about to enter a parabolic (5 wave) 5th wave. The only concern is how high it will go.
TPS are at the 0.618 Fibonacci retracement - 675 USD, and the 4.236 Fibonacci ratio - 1695 USD.
The potential future for Quant is hard to comprehend, as it is near limitless. I believe these targets will be laughed at by bag holders who know how amazing tokenomics are, however I am not taking chances and aiming for the moon... just a casual 16x ;)
Bring it on... stay Quamfy


I hate $QntusdtHello guys
here is game plan for $qnt.
pls the highlighted prices for SL, Entry and Tp
enjoy

QNT Usdt#QNT Price update.
After a confirmed breakout from the level at $114.4, that is a good point for an entry.
Look for a 4-hour candle close above the level before taking an entry.
Remember always use stop loss.
Everything is on the chart.

QNTUSDT LONG BUY SIGNALQNTUSDT LONG BUY SIGNAL
Wait for price to break the downtrend resistance and close above 107 or preferably above 110.
You can enter at the breakout, or at the retest.
TP1 115
TP2 120
TP3 125
TP4 130
SL 99
Spot or Leverage 2-5x


QNT outlookI have taken a long position on QNT as it is displaying strength across all time frames. It appears to be recovering from its bearish sentiment.

QNT ANALYSIS🔮 #QNT Analysis - Breakout 🚀🚀
💲💲 As we can see that there was a formation of Descending Triangle Pattern and Cup and Handle Pattern in #QNT and #QNT breakout the descending triangle pattern. But currently #QNT is trying to sustain above the major support area. If it breakout and close above the major resistance area and also breakout the neckline of Cup and Handle Pattern then we will see a bullish move. 📈📈
💸Current Price -- $108.4
📈Target Price -- $144.1
⁉️ What to do?
- We have marked crucial levels in the chart . We can trade according to the chart and make some profits. 🚀💸
🏷Remember, the crypto market is dynamic in nature and changes rapidly, so always use stop loss and take proper knowledge before investments.
#QNT #Cryptocurrency #DYOR

QNT/USDT The price show a bullish momentum for back to upward!💎 QNT has recently demonstrated notable market dynamics, currently in the process of retesting the demand area.
💎 If this retesting phase proves to be valid, there is a possibility of the price climbing upward with the next target being the resistance area. A successful breakout from this resistance area could probability pave the way for an easy movement towards our target area.
💎 However, if QNT fails to bounce at the demand area, the price may potentially retreat to the Bullish Order Block (OB) area to gather new momentum for an upward movement.
💎 QNT must bounce from the Bullish OB area if it intends to sustain its upward trajectory. Failure to bounce, resulting in a breakdown of this area, could signal a bearish trend continuation, leading to further downward movement.

QNT has formed a Bullish pattern at the resistanceQNT has formed a Bullish pattern at the resistance. After the breakout the price can continue to go up.
🔵Entry Zone 109.1 - 112.2
🔴SL 103.58
🟢TP1 117.19
🟢TP2 123.98
🟢TP3 132.02
Risk Warning
Trading Forex, CFDs, Crypto, Futures, and Stocks involve a risk of loss. Please consider carefully if such trading is appropriate for you. Past performance is not indicative of future results.
If you liked our ideas, please support us with your likes 👍 and comments.

#QNT/USDT - Long - Potential 37.82%Strategy: Long
Exchange: BINANCE
Account: Spot
Entry mode: DCA Limit
Risk: 1%
Exit:
• ⎿ Target 2 : 152.7 37.69%
• ⎿ Target 1 : 120.2 8.39%
DCA Entries
• ⎿ Entry : 110.9 - 100%
• ⎿ Current market price: 110.9
Stop: 99.4 (-10.37%)
Technical indicators:
Long term trendline break out was immediately followed with price breaking through the 20, 50 and 200 moving averages. Nice block of support below price, RSI in solid uptrend showing bullish momentum.
Also QNT looks to be lagging behind the current market cycle of BTC pump followed by high caps, then mid caps. QNT should be in the next round of pumps as volume trickles down through the market.
• ⎿ 24h Volume: 7746163.2273
• ⎿ Satoshis: 110.9
• ⎿ Analysis: TradingView

QUANTWhat Is Quant (QNT)?
- Quant launched in June 2018 with the goal of connecting blockchains and networks on a global scale, without reducing the efficiency and interoperability of the network. It is the first project to solve the interoperability problem through the creation of the first blockchain operating system.
- Strong Project.
------------------------------------
Trading Part
------------------------------------
- Bullish Weekly Divergence.
- In contact with Lower BB.
------------------------------------
- Buy Zones :
- Buy 100$ ish ( 25% invest )
- Rebuy 50$ ish ( 75% invest )
- TP : 148$
SL : No need
------------------------------------
-- Follow BTC Movements.
-- Never go all in.
-- always keep juice to rebuy.
-- manage your risks.
Happy Tr4Ding!

QNTUSDT - LongPosting for my own future reference.
In short:
- USDT pair not looking extremely bullish, but there is some support on the 2D GRM
- BTC pair printing strong bullish divergences on multiple timeframes (majorly oversold on 1D/2D and very strong indicators flashing green on 1W(!) chart)

QNT/USDT Gearing Up for a Bull Run? 👀🚀QNT Analysis 💎Paradisers, let's direct our attention to #QNTUSDT, as it's showing signs of a potential significant move from a key demand level.
💎#Quant is charting an upward path, indicating a likely bullish breakout from its current demand zone. We anticipate a retest of the demand level at $100, with a significant supply zone on the horizon. If #QNT maintains its position above this threshold, it may initiate an ascent toward the major supply zone at $150.
💎If #QNT struggles to sustain its position above the support level, a revision of our trading approach may be in order. In such an event, we would look towards triggering a bullish movement from a lower bullish Order Block (OB).
💎Monitoring this level is essential, as a dip below could trigger a considerable bearish trend.
💎Stay vigilant and flexible, Paradisers. Your ParadiseTeam is committed to delivering the latest insights and strategic advice, ensuring you're equipped to adeptly handle these market movements.

QUANT (QNT) - A Deep Dive into Its Bullish Weekly Timeframe Hello, TradingView aficionados!
Today, I'm taking a closer look at QUANT (QNT), specifically analyzing its performance on the weekly timeframe. There's a lot to unpack here in terms of technical indicators and bullish signals, so let's dive into the nitty-gritty.
Weekly Timeframe Analysis:
Support/Resistance (S/R) Dynamics: On the weekly chart, QUANT has been consistently testing and respecting key S/R levels. The recent bounce off a significant support level indicates strong buying interest at these price points, a bullish signal for potential upward movement.
Trend Analysis: The application of trend lines and channels on the weekly timeframe reveals a potential reversal pattern. Look out for a breakout above the descending trend line which could signify a trend reversal from bearish to bullish.
Bullish Indicators and Metrics:
Volume Analysis: An uptick in trading volume accompanying price increases is a sign of strong buyer interest, adding credence to the bullish outlook.
Fundamental Overlays:
While the focus here is on technical analysis, it's always beneficial to overlay fundamental aspects. QUANT's unique proposition in blockchain interoperability and its enterprise-grade solutions provide a solid fundamental backdrop to the technical outlook.
Trading Strategy:
Entry Points: Identify entry points post a confirmed S/R flip or a breakout from the descending trend line.
Exit Points: Setting up profit targets near historical resistance levels and using trailing stops can optimize exit points.
Risk Management: Given the inherent volatility in crypto markets, it's crucial to manage risk by allocating only a portion of your portfolio to such trades and setting up strict stop-loss orders.
Conclusion:
QUANT's weekly timeframe analysis paints a bullish picture, backed by several technical indicators. However, always remember, no analysis is foolproof. Diversify your risks and keep abreast of broader market movements.
Eager to hear your analysis and viewpoints on QUANT’s current market position. Let's engage in a fruitful discussion!
Happy Trading!

QNT/USDT Glimmer of Bullish Potential Amidst the Dips?👀🚀Quant💎 Paradisers, let's dive into #QNTUSDT, where an intriguing pattern has emerged right at a key demand zone, hinting at a possible upswing ahead.
💎 Peeking at #QUANT recent journey, we've seen a bit of a downhill trend, marking a series of new lows that suggest a bit of a slump. However, it's key to point out that the mood has been mostly bearish of late.
💎 Here's where it gets interesting: the price has just hit a sweet spot at the crucial demand level of $95.7. If it can keep steady here, we might just see a strong bounce back, potentially shaking up the supply status quo.
💎 Ready for anything, we traders have our eyes on different paths. If #QNT doesn't kick off the expected bullish flip, we might look to regroup at a slightly softer demand level of $89.5. But, a slip below this floor could spell out a deeper dive into bear territory.

QNTUSDT Trading opportunityQNT is currently experiencing a correction, reaching the immediate support area, potentially acting as a weak demand zone. Within this zone, the price has completed the initial ABC correction, signaling a likelihood of an upward movement for another ABC pattern formation towards the Internal Supply area.
The upcoming price reaction within this zone is crucial; a breakout could reignite the bullish trend continuation. However, if the Internal Supply Area proves to be formidable resistance, resulting in price rejection, there's a possibility of breaking the previous low established in the weak demand zone. This could lead to a direct movement towards the External Demand area, representing a significant phase for bullish accumulation.
The trajectory, outlined on the chart, indicates targets towards the mid term target and External Supply area. It's essential to trade cautiously, implementing appropriate stop-loss strategies when necessary.
Comments are welcomed, and your support in boosting this analysis is highly appreciated.
Thank you for your engagement and participation in the discussion.

Quant LongDoing a TA on quant over the last few weeks and the baseline price of 113 is the best price to pull a long. TP at 125-135.

QNT and Bull flag formingQNT is forming beautiful bull flag, with volume it can go higher in next days...
Always manage your risk and use stoploss. Not a financial advice

QNTUSDT # 001 ( Bullish rally to 550 $ and 700 $ ) Hello dear traders.
Good days .
On monthly Gann Square , at 0.618 Reversal time zone , QNTUSDT start 2nd Bullish Gann Square and reached to the strong Gann Square Fan line resistance.
Expected to reach itself to the 0.382 Gann Box fib level (550 $ ) at next reversal time zone which will be around April 17 , 2024 .
In detail chart will updated to Enter at Correct Time and Correct Price .
Chart updated and route plotted with help of Gann Square and Gann Box.
Good luck and safe trades.
Thanks for your support and comments
