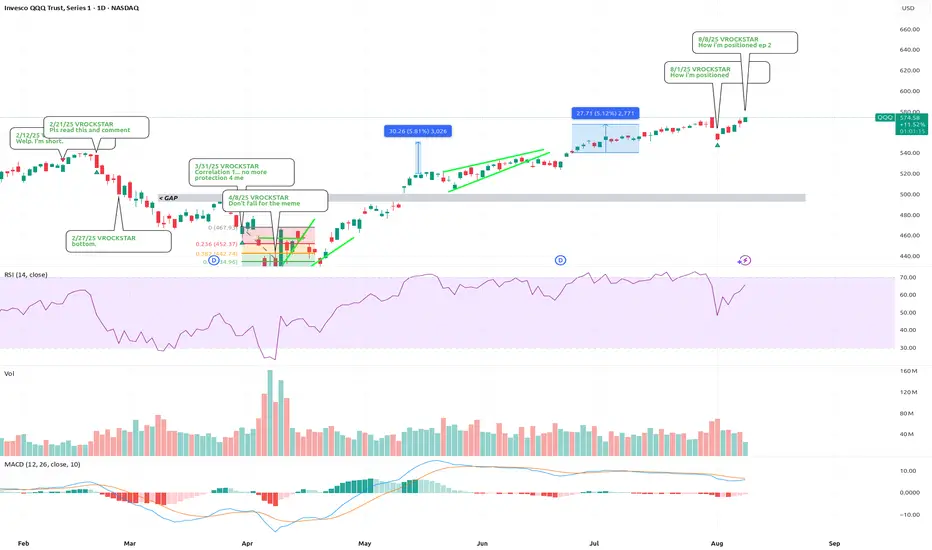
8/8/25 - $qqq - How I'm positioned ep 28/8/25 :: VROCKSTAR :: NASDAQ:QQQ
How I'm positioned ep 2
- TV's tools suck so bad that i went to check something and it deleted my note in draft, so instead of just saying eff it, i'll retype the TL;DR points
- index headed higher into YE, but feels like needs to reset either a bit lower or grind sideways before it can "leap"
- a ton of names trade MSD++ fcf yields and grow MSD-DD+ and are easy MT buys, hard to differentiate, but supportive of index too beyond mega cap
- that being said, hard to beat oppty cost of OBTC given S-1 filed this week, i'd link it but tradingview doesn't like me helping people do DD - so go to EDGAR to pull it up
how i'm positioned
65% OBTC/ 35% ibit gross short. playing the spread 12% discount to spot on OBTC as we speak. preparing for this to close in anywhere from 1 to 3 months. best guess would be it's LIVE by end of oct
OTC:OBTC/BINANCE:BTCUSDT/0.000324
NXT at 8% notional/ 15% gross (ITM leaps)
Deck at 5% notional/ 15% gross (ITM leaps)
ONON at 2% notional/ 8% gross (ITM leaps)
GAMB at 2% notional/ 6% gross
SES 5% but covered above $1 thru oct
10-15% cash for ammo, prob to further stack $OBTC.
have a good weekend.
V
QQQ trade ideas
QQQ (8 August)Uptrend continues spite selective leadership - only 5.9% new highs
Target @ $564 for next week off a new high based on an expectation CPI/PPI is higher than expected which coupled with weakening growth expectations (GDP, housing, etc.) jinxes the narrative around September's rate cut hopes
Has QQQ topped? Levels to the downsideI think we've seen a top here with the reversal that happened today. My levels held on SPY and that makes me more convinced the Nasdaq will have the same fate.
The top looks much clearer on Nasdaq futures. We have a double top, should the highs of today hold.
If you were to run a trend line through price, you'd see that all we've done on this rally is backtested the trend line from the April lows and have found resistance.
I think the next move is likely a large move down towards the lower support levels. Potentially CPI tomorrow is the catalyst.
Let's see where we end up, but I think it'll be one of the lower support levels should the highs hold throughout the week.
Nasdaq at or near end of trend?Broadening top seen, with current PO if the recent high is the top. There’s still room to run higher to test the upper boundary of this pattern. Should the current potential head and shoulders top on the hourly chart break out to the downside then the odds of the top being in now increases.
The same head and shoulders pattern is showing up in the major averages and also for Berkshire Hathaway.
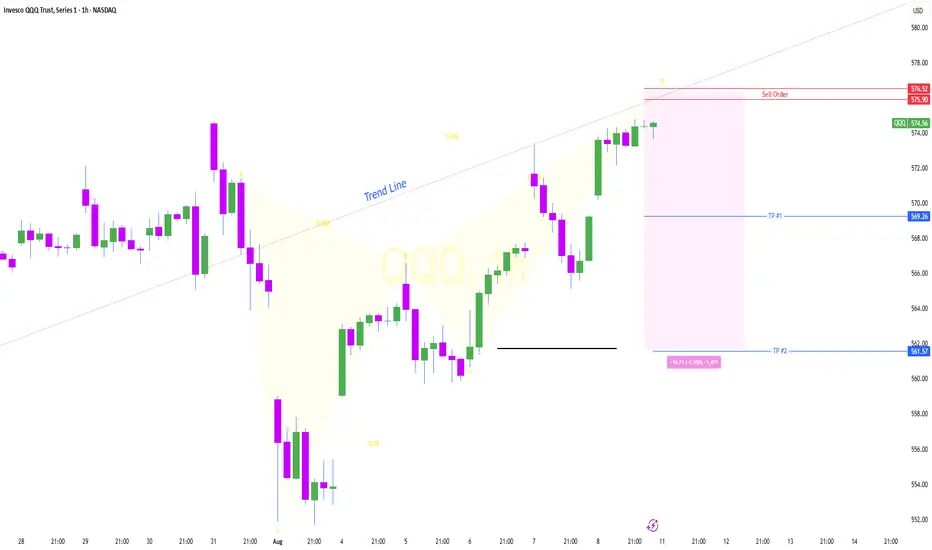
QQQ ShortThe QQQ is likely to decline from the 576 level, influenced by the Butterfly Pattern, and may move toward its anticipated target.
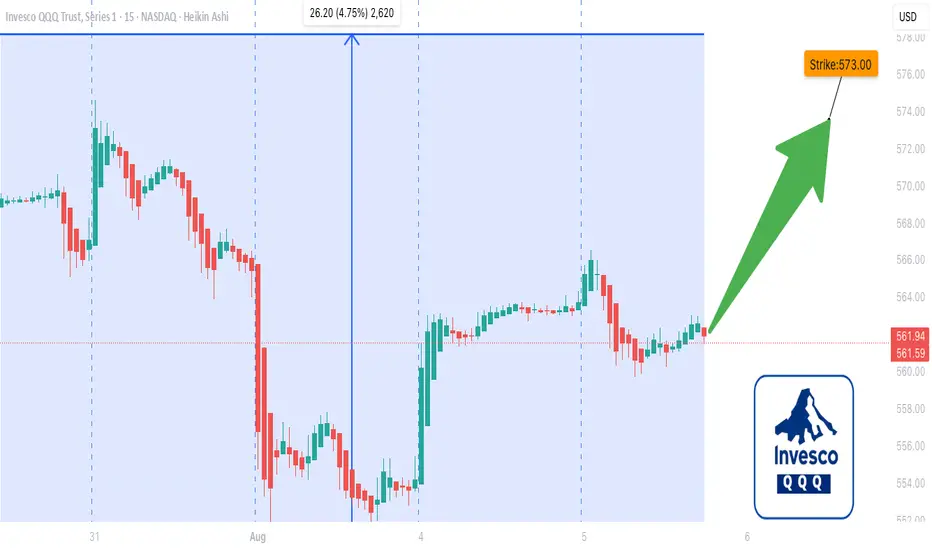
QQQ $573C Looking HOT **QQQ \$573C Looking HOT 🔥 Weekly RSI Surges – Models Align on Call Setup 🚀**
---
### 📊 **Post Body (Formatted for TradingView):**
**QQQ Weekly Options Play — Aug 8 Expiry (3DTE) 💥**
📈 **Momentum Snapshot:**
* **Weekly RSI:** 🔼 67.9 and rising
* **Daily RSI:** ⚖️ Mixed (short-term weakness)
* **Volume Trend:** Mixed — bullish accumulation OR institutional selling
* **Gamma Risk:** ⚠️ Moderate
* **Time Decay:** ⏳ Accelerating
---
🧠 **Model Consensus Summary:**
* **Grok / Claude / Llama:** 🔥 Bullish — Weekly RSI + volume support
* **Gemini (Google):** 🧊 No trade — Conflicted volume view
* **DeepSeek:** 😐 Bullish with caution — Volume red flag acknowledged
✅ **Consensus Direction:** **Moderate Bullish**
🛠️ **Trade Setup:** Long CALL
---
### 🧾 **Trade Specs:**
* 🟢 **Instrument:** QQQ
* 📈 **Strike:** \$573
* 📅 **Expiry:** Aug 8, 2025
* 💵 **Entry Price:** \$0.86
* 🎯 **Target:** \$1.30
* 🛑 **Stop:** \$0.43
* 📏 **Size:** 2 contracts
* 💪 **Confidence Level:** 70%
* ⏰ **Entry:** Market Open
* 🕒 **Posted:** 2025-08-05 08:03 EDT
---
🚨 **Risk Notes:**
* Institutional selling may cap upside 📉
* Mixed RSI suggests staying nimble ⚠️
* Only 3 DTE — exit FAST if it runs 💨
---
📦 **Trade JSON (Copy for Auto-Loggers):**
```json
{
"instrument": "QQQ",
"direction": "call",
"strike": 573.00,
"expiry": "2025-08-08",
"confidence": 0.70,
"profit_target": 1.30,
"stop_loss": 0.43,
"size": 2,
"entry_price": 0.86,
"entry_timing": "open",
"signal_publish_time": "2025-08-05 08:03:16 EDT"
}
```
---
### 🏷️ **Tags (TradingView Format):**
`#QQQ #OptionsAlert #WeeklyOptions #CallOptions #TechStocks #MomentumTrading #RSI #EarningsPlay #OptionsFlow #GammaSqueeze #TradingSignals #QQQTrade #Nasdaq100 #TradingStrategy #SPYQQQ`
QQQ JUST FLASHED THIS SIGNAL FOR THE FIRST TIME SINCE 2019!!!A pattern has just showed up on QQQ for the first time in 6 years, and we have to talk about it because it has significant implications for the next 3 years of the stock market


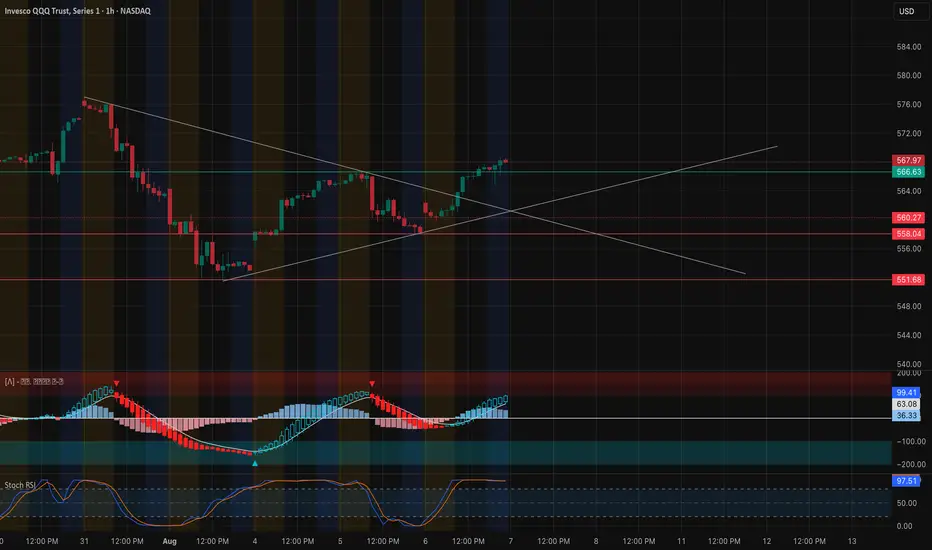
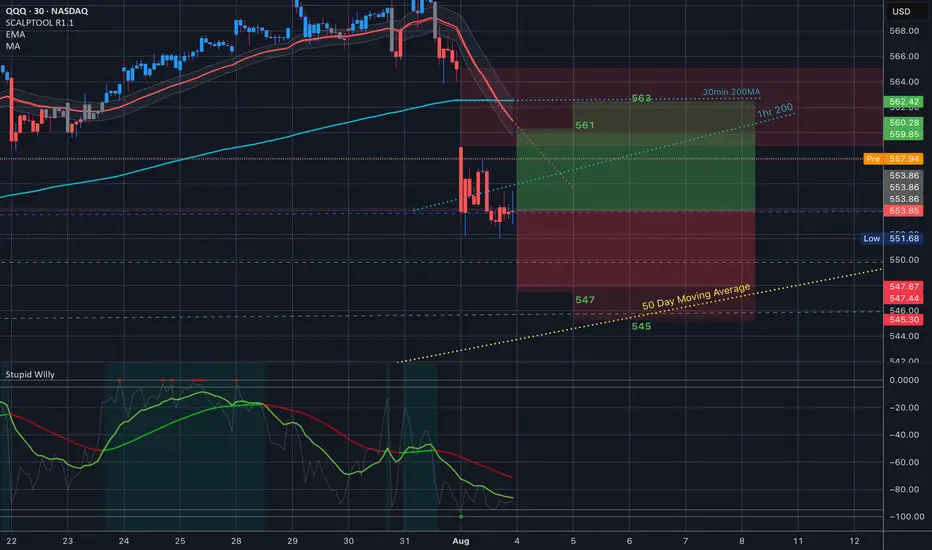
QQQ Pressured Below Downtrend Line. TA for Aug. 6QQQ Pressured Below Downtrend Line – Bearish Momentum Building
Market Structure (1H View)
* QQQ remains in a descending channel, with price recently rejecting near the upper trendline resistance around $566–$567.
* The recent drop signals sellers defending the downtrend line, pushing price back toward mid-channel.
* Macro structure still leans bearish until price can break and hold above the channel.
Key Price Zones
* Immediate Resistance: $564–$567 (trendline rejection zone)
* Major Resistance: $577 (macro swing high level)
* Support: $551–$552 (key demand zone + previous consolidation base)
* Deeper Support: $545–$546 (prior low / psychological level)
Indicators
* MACD: Bearish crossover forming; momentum bars turning red, signaling increased downside pressure.
* Stoch RSI: Cooling off from overbought levels, moving lower—suggesting potential continued weakness.
* Trendlines: Price trapped between descending resistance and mid-channel support.
Current Bias
The rejection near $566–$567 and drop in momentum suggest sellers are regaining control. A retest of $551–$552 is possible if bearish momentum accelerates.
Scenarios to Watch
🟢 Bullish Case:
* Break & close above $567 → likely move toward $577.
* Needs strong buying volume and MACD bullish reversal to confirm breakout.
🔴 Bearish Case:
* Failure to reclaim $564 with sustained selling → drop toward $552 support.
* If $552 fails, deeper flush toward $545–$546 possible.
Trade Ideas (Not Financial Advice)
* Short Bias: If rejection continues at $564–$566 zone, target $552 with tight stop above $567.
* Long Setup: Only if price breaks $567 with strong bullish momentum; target $577.
📌 Final Thoughts
QQQ is in a pressure cooker at the top of its descending channel. Without a bullish breakout soon, the path of least resistance remains lower toward $552. Keep a close watch on intraday momentum shifts for confirmation.

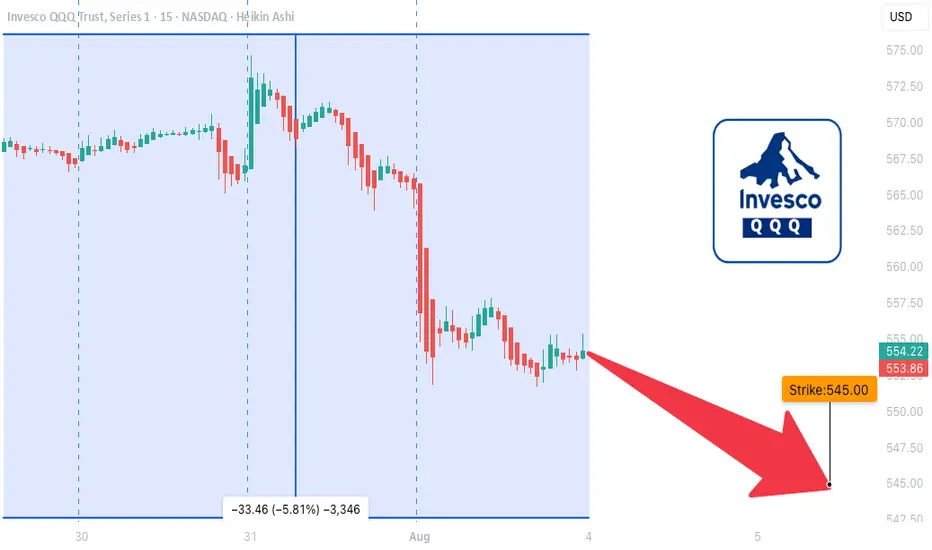
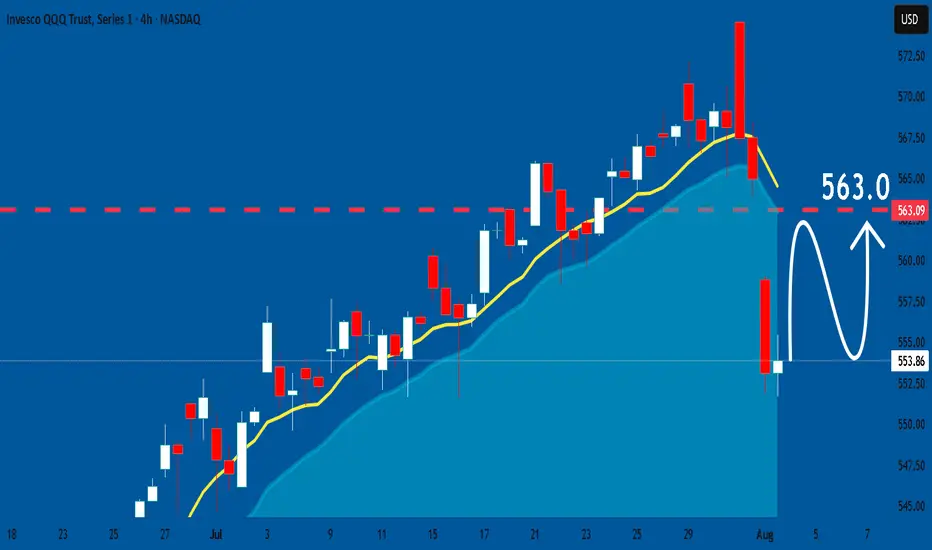
QQQ LEAP Trade Thesis – Aug 1, 2025
🧠 **QQQ LEAP Trade Thesis – Aug 1, 2025**
🎯 **Setup**: High-conviction LEAP PUT
📉 **Bias**: 🔻 *Moderate Bearish*
📆 Horizon: Long-Term (12+ months)
---
📊 **Multi-Model Intelligence Summary**
🧪 **Grok (xAI)**
• Monthly RSI = bearish 📉
• Trading near 52W highs = overvalued 💥
• Suggests: \$545 PUT
🧠 **Gemini (Google)**
• High conviction bearish
• Suggests: \$590 PUT (expensive premium)
🧬 **Claude (Anthropic)**
• RSI breakdown = confirmed weakness
• Recommends: \$530 PUT for max downside
🦾 **Meta (LLaMA)**
• Moving averages turning over
• Suggests: \$555 PUT – moderate confidence
🛰️ **DeepSeek**
• Long-term RSI confirms bearish drift
• Volatility ideal for LEAP entries
• Recommends: \$545 PUT
---
📍**MODEL CONSENSUS**
✅ Bearish trend across all models
✅ Favorable volatility (VIX ✅)
✅ Overvaluation = downside pressure
⚠️ Strike variance across models → we anchor at **\$545** for balance
---
💼 **TRADE SETUP (LEAP PUT)**
• 🔻 Direction: PUT (Short)
• 🎯 Strike: **\$545**
• 📆 Expiry: **2026-09-18** (413 days)
• 💰 Entry Price: **\$38.33**
• 🎯 Target: **\$76.66**
• 🛑 Stop: **\$24.91**
• ✅ Confidence: **75%**
• ⏰ Entry: Monday Open
• 📏 Size: 1 contract
---
📌 **Narrative**:
Every model says the same thing: RSI rollover, inflated price, and perfect LEAP conditions. Institutions are neutral → retail can front-run the decay. You don’t often get long-dated PUTs this clean.
🎯 Asymmetric risk/reward.
📉 Macro setup aligns.
🎯 Strong long-term positioning play.
---
🧠 Stay smart. Position early. Ride the macro shift.
🔔 Like + Follow for more AI-driven trade setups.
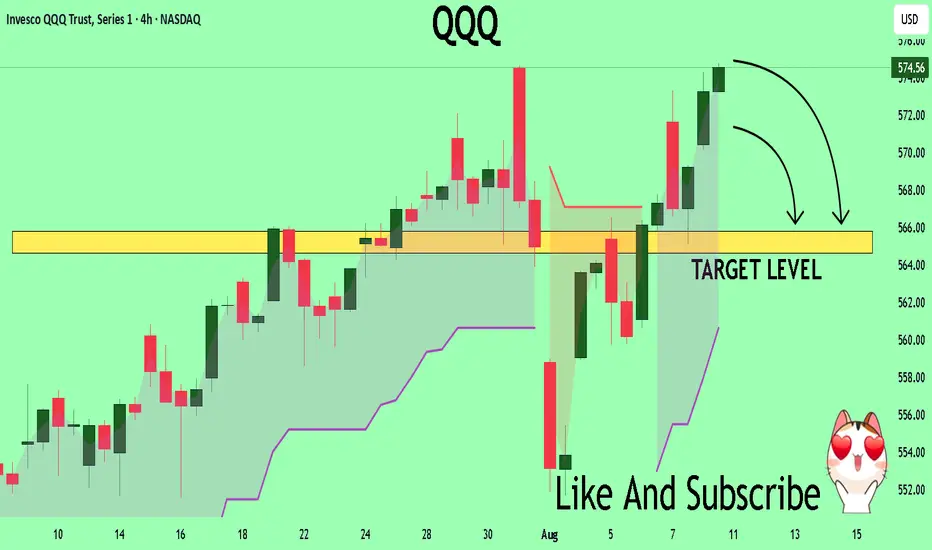
QQQ Set To Fall! SELL!
My dear friends,
My technical analysis for EURUSD is below:
The market is trading on 574.56 pivot level.
Bias - Bearish
Technical Indicators: Both Super Trend & Pivot HL indicate a highly probable Bearish continuation.
Target - 565.83
About Used Indicators:
A pivot point is a technical analysis indicator, or calculations, used to determine the overall trend of the market over different time frames.
Disclosure: I am part of Trade Nation's Influencer program and receive a monthly fee for using their TradingView charts in my analysis.
———————————
WISH YOU ALL LUCK
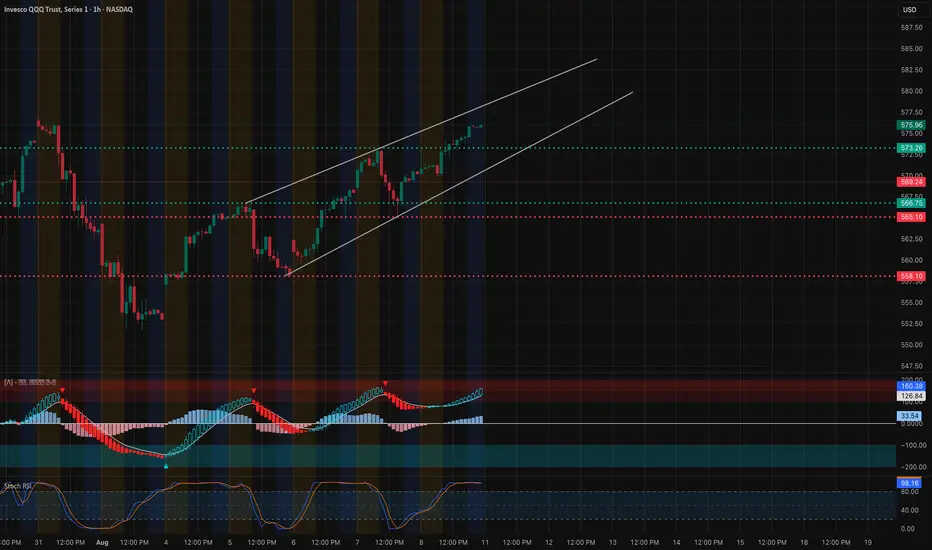
QQQ Technical Analysis & Options Sentiment Outlook. Aug. 11
Technical Analysis (1H Chart)
QQQ is trading at $575.96, continuing to ride inside a well-defined ascending channel. The price action shows consistent higher highs and higher lows, with the current test near the upper boundary of the channel. Immediate resistance sits at 577–578, where the previous swing high and channel top converge. A breakout above 578 could open the path toward 580–582.5, aligning with the upper channel projection.
On the downside, the first support is at 573.2 (recent breakout zone), followed by 569.2 and 566.7 as deeper pullback levels. The MACD remains bullish with widening histogram bars, but Stoch RSI is overbought (>95), suggesting potential short-term consolidation or a minor pullback before continuation.
Bullish Scenario: Break above 578 with strong volume can push toward 580–582.5.
Bearish Scenario: Failure at 577–578 with rejection could bring a pullback toward 573.2 and possibly 569.2.
GEX / Options Sentiment (1H View)
* Key Call Walls:
* 577.00 – Highest positive NET GEX / Gamma Wall resistance
* 574.00–575.00 – 3rd Call Wall (54.5%)
* 572.00 – 2nd Call Wall (55.78%)
* Key Put Walls:
* 571.00 – 3rd Put Wall (-6.95%)
* 565.00–566.00 – HVL support & PUT wall
* 560.00 – Strong PUT support (-59.08%)
* GEX Bias: Positive above 572–573, meaning upside moves may slow due to dealer hedging, but still favor controlled grind higher. Negative GEX below 571 signals accelerated selling potential.
* Options Flow: Puts at 53.9% indicate a slightly defensive stance despite the bullish price structure. IVR is low at 11.7, suggesting cheaper options pricing.
Options Strategy Thoughts:
* Bullish Swing: Call debit spreads targeting 580–582 if price confirms above 578.
* Bearish Hedge: Short-term puts or put spreads if rejection at 577–578 aligns with overbought conditions.
* Neutral: Consider selling iron condors around 565–580 range if expecting channel-bound trade before a breakout.
Disclaimer: This analysis is for educational purposes only and does not constitute financial advice. Always do your own research and manage risk before trading.
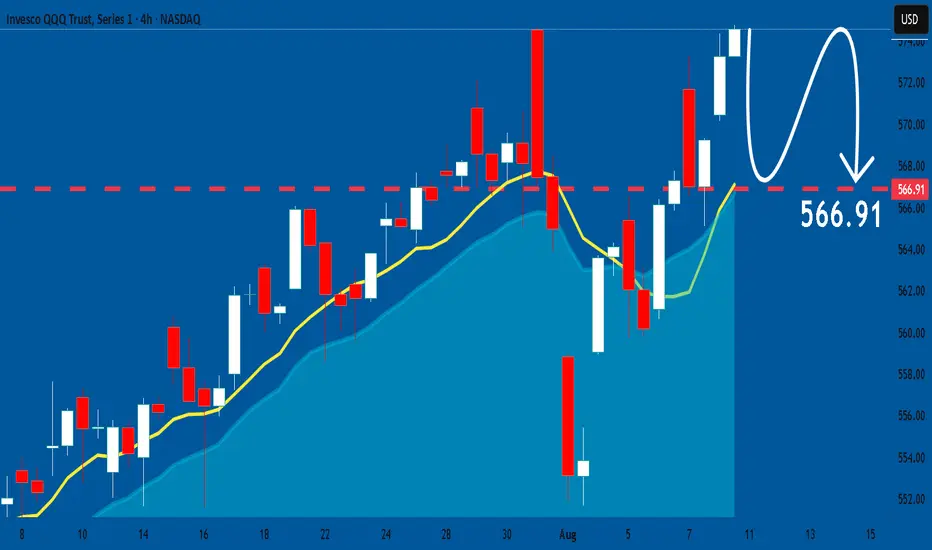
QQQ: Bearish Continuation is Highly Probable! Here is Why:
Looking at the chart of QQQ right now we are seeing some interesting price action on the lower timeframes. Thus a local move down seems to be quite likely.
Disclosure: I am part of Trade Nation's Influencer program and receive a monthly fee for using their TradingView charts in my analysis.
❤️ Please, support our work with like & comment! ❤️
QQQ Breaks Out! Can the Bulls Defend the Zone Above 566? Aug7Technical Analysis (1H)
QQQ has finally broken out of the symmetrical wedge pattern, closing above the key 566–567 resistance zone and now testing the 568.60 level. This move confirms bullish momentum as the price holds above the trendline retest.
* Trendline Breakout: Clean breakout from the descending wedge with follow-through candles.
* Structure Shift: Higher lows and higher highs are forming, signaling trend reversal.
* Momentum:
* MACD: Bullish crossover with increasing histogram bars supports the breakout.
* Stoch RSI: Topped near overbought but still pointing upward — watch for potential divergence or consolidation.
* Support Zones:
* 566.60 → Retest zone from prior breakout
* 563.40 → Demand zone aligning with GEX support
* 560 → Critical support and prior resistance
* Resistance Zone:
* 568.60 → Current price testing a key rejection area from prior supply zone
If QQQ holds above 566 on retest, continuation toward 572–574 is likely. If it breaks below 563, short-term weakness may follow.
Options Sentiment & GEX Analysis
GEX data supports a tight battle zone around 567–568.
* Resistance Clusters:
* 568.63 → Highest positive NETGEX and heavy 3rd CALL wall (13.56%)
* 570–572 → GEX7 to GEX10 cluster (light resistance)
* Support Levels:
* 566 → Strong 2nd CALL Wall (15.68%)
* 563.40–564 → GEX9 and GEX8 support (cumulative ~5%)
* 560 → HVL, key pivot for downside protection
* Options Flow:
* Puts at 62.9% dominance → Contrarian bullish bias forming
* IVR 15 / IVx avg 17.9% → Low implied volatility; premium buyers are favored
* GEX 0% → Neutral gamma pressure, so price can move more freely with volume
This GEX structure shows call walls above, but strong net gamma support below. If bulls hold 566–567, they can attempt a push toward 572 into mid-August expiration.
Conclusion:
Bulls are in control above 566. As long as QQQ holds that breakout zone, upside momentum could target 572+. A breakdown back below 563 opens up downside back to 560 or lower. Watch for volume confirmation and IV expansion.
Disclaimer: This analysis is for educational purposes only and does not constitute financial advice. Always do your own research and manage risk accordingly.
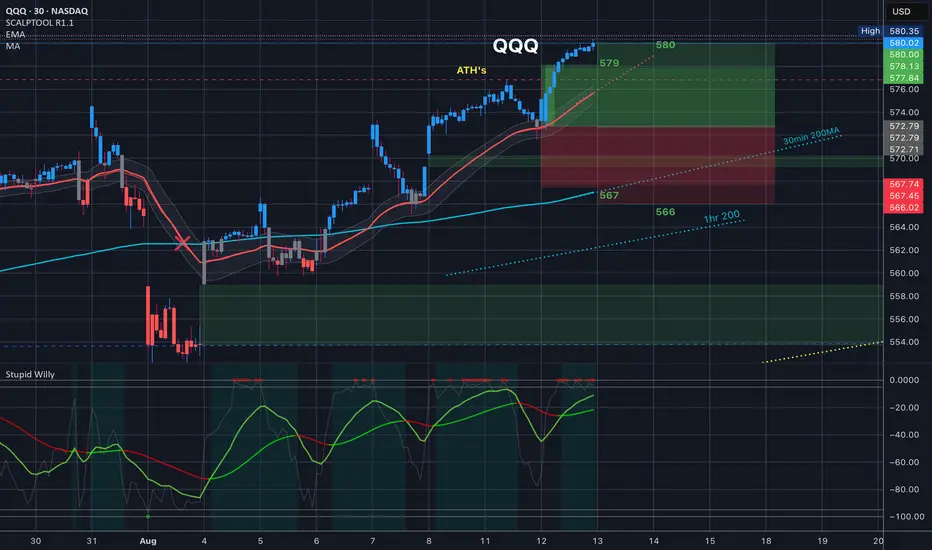
$QQQ Made new ATH’s // Last Friday review
QQQ made new ATH’s on Friday. Be careful spread traders QQQ has been blowing through the top of the trading range, but also because we did take it to the top of the trading range I would think we have a flat or down day here… 575/576 bear call spreads feel good to me. Do your own DD, but that’s what I’m looking at for tomorrow!!

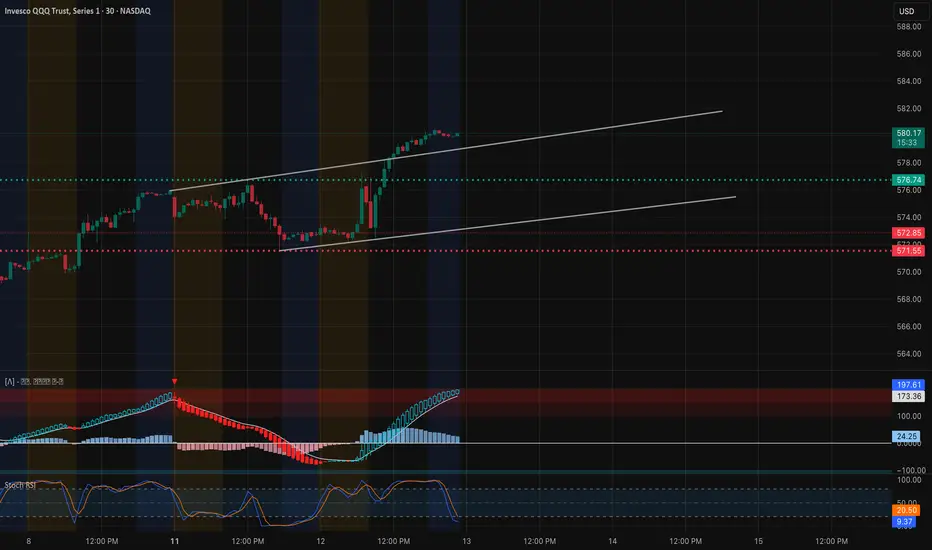
QQQ – TA + GEX Confluence for August 13, 202530-Minute Price Action
QQQ is pushing higher inside a rising channel after breaking through $576.74 support-turned-resistance.
* Resistance: $580.17 – current upper channel limit and intraday high.
* Support: $576.74 – breakout retest level; $572.85–$571.65 – key downside pivot zone.
* Indicators:
* MACD remains strongly bullish, but histogram is showing early signs of slowing momentum.
* Stoch RSI is in oversold territory after a minor pullback, suggesting potential for another push higher if momentum returns.
1-Hour GEX Insights
* Highest Positive NET GEX / Gamma Wall: $580 – aligns with the 30m resistance and current intraday high.
* Call Walls Above: $582 (next gamma level) and $585 (upper extension target).
* Put Support: $572 (first defense) and $565–$567 (major downside gamma floor).
* IVR: 9.8 – low implied volatility rank, keeping long options relatively cheap.
TA + GEX Combined Read
The $580 level is a dual confluence zone — it’s both the 30m upper channel resistance and the highest GEX wall on the 1h chart.
* A breakout above $580 could see quick follow-through toward $582 and possibly $585 if call buying pressure builds.
* Failure to break $580 with conviction could bring a retest of $576.74, with deeper pullback potential to $572 if sellers take control.
Trading Scenarios for August 13
* Bullish Breakout: Long calls or debit spreads above $580 targeting $582–$585.
* Bearish Rejection: Puts or put spreads if $580 rejects and $576.74 fails, targeting $572.
* Range Strategy: If price stays between $576–$580, short premium plays could work given low IVR, but be ready for a breakout.
Reasoning
The 30m rising channel aligns perfectly with the 1h GEX data, showing $580 as the decision point for tomorrow. Breaking above it can trigger gamma-fueled upside, while rejection keeps QQQ range-bound or sends it back to GEX-supported floors.
Disclaimer: This analysis is for educational purposes only and does not constitute financial advice. Always do your own research and manage risk appropriately before trading.
$QQQ Analysis, Key Levels & Targets
What a crazy day. We had CPI in premarket today then we kept up and we took it past all-time highs to the top of the implied move to the top of the implied move on the next day so we close just above 5 cents above 580
Volatility got crushed today CBOE:VXN down -7.32 destroying options and shorts betting on downside
DID YOU SEE the bounce on the 35EMA by the way??
I do believe that tomorrow we will be trading under 581. Thursday we have PPI and because we're in an in between day tomorrow I think we might be a little bit more flat also look at how high up that 35 EMA is within the training range
(HIT GRAB THIS CHART - UNDER THE CHART NEXT TO THE 🚀)
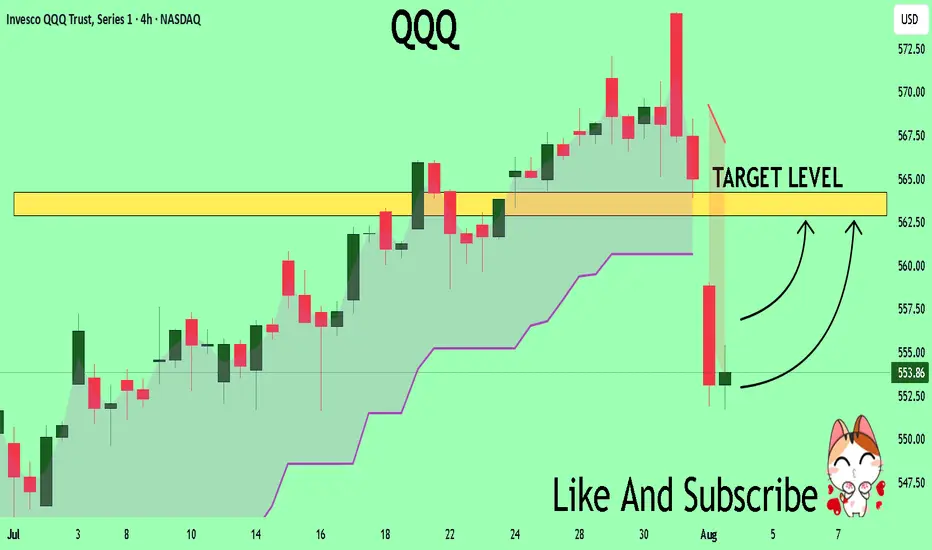
QQQ The Target Is UP! BUY!
My dear friends,
Please, find my technical outlook for QQQ below:
The instrument tests an important psychological level 553.86
Bias - Bullish
Technical Indicators: Supper Trend gives a precise Bullish signal, while Pivot Point HL predicts price changes and potential reversals in the market.
Target - 562.88
About Used Indicators:
Super-trend indicator is more useful in trending markets where there are clear uptrends and downtrends in price.
Disclosure: I am part of Trade Nation's Influencer program and receive a monthly fee for using their TradingView charts in my analysis.
———————————
WISH YOU ALL LUCK
QQQ: Expecting Bullish Continuation! Here is Why:
Our strategy, polished by years of trial and error has helped us identify what seems to be a great trading opportunity and we are here to share it with you as the time is ripe for us to buy QQQ.
Disclosure: I am part of Trade Nation's Influencer program and receive a monthly fee for using their TradingView charts in my analysis.
❤️ Please, support our work with like & comment! ❤️
$QQQ Analysis, Key Levels & Targets 8.4.25
Today’s Trading Range - we have a great range expansion here from last Friday’s drop. Some interesting targets here. Let me know what you see.
Grab this chart - and let’s go
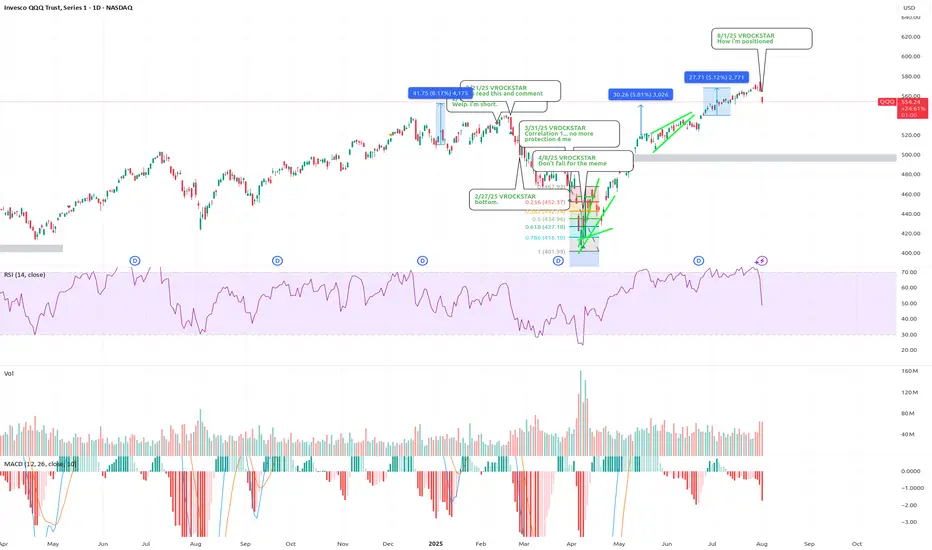
8/1/25 - $qqq - How i'm positioned 8/1/25 :: VROCKSTAR :: NASDAQ:QQQ
How i'm positioned
- 2x leverage on the whole book. 75% at risk so 150% gross
- so 25% powder
47% obtc
30% nxt (12.5% leaps)
36% deck (ST and leaps for 6.5%)
27% lulu (ST gas for 1% lol!)
8% mstr (ST gas for 80 bps lol!)
5% gme (ST gas for 40 bps!)
5% ses (covered with calls at 1 strike already)
be well. let's attack monday.
if we dip monday i think >50% chance that's the low
if we don't, i think >30% chance we go higher
so i'm bidding this selectively w balance of ST gas and high conviction plays.
V
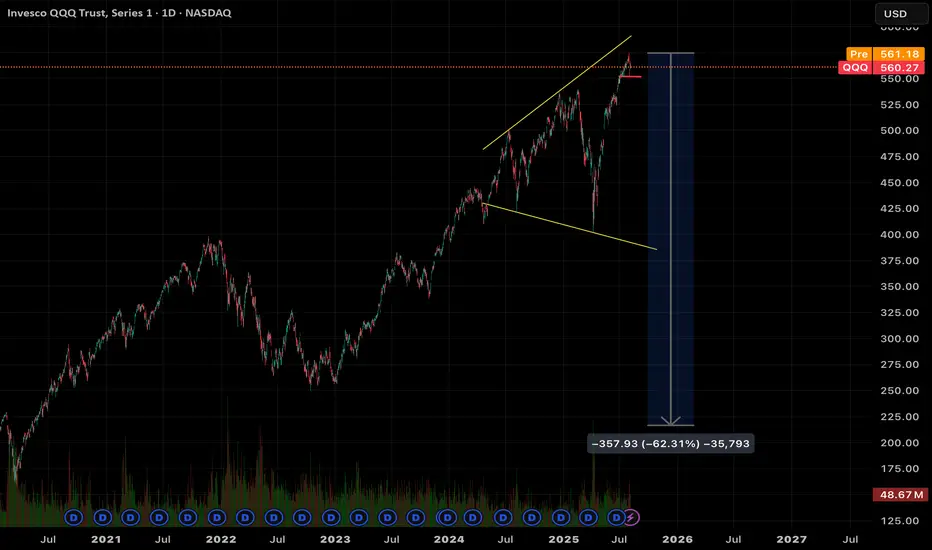
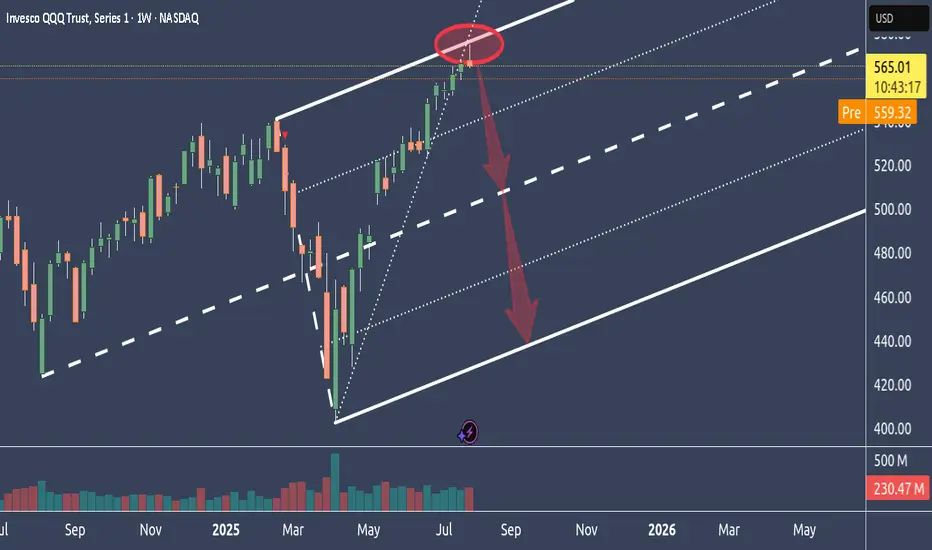
Why NQ is probably tanking big timeIn this weekly chart, we see QQQ, which represents the Nasdaq.
As we can see, it had a hell of a run up.
Too far too fast IMO, and it reached the stretch level at the Upper Medianline Parallel.
The natural move is now to let go, take a breath and trade down to center again, which is the Centerline.
After all the most major and most important earnings results are over, and Funds have pumped up their gains through manipulative Options plays, it's time to reap what they have planted and book the gains.
It's all in line with, all moves are at the point, and everything is showing in a simple chart.
Unless price is opening and closing outside of the U-MLH, it's time to load the Boat and sail to the South.
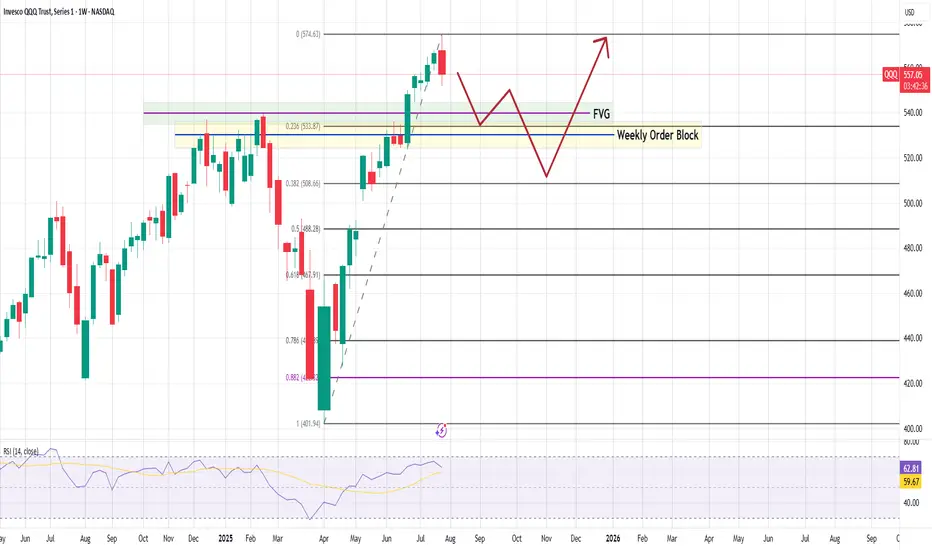
#QQQ Weekly Chart – Technical Breakdown As of August 1, 2025QQQ Weekly Chart – Technical Breakdown
🧠 Key Observations
Bearish Weekly Rejection
A red candle at the recent high ($574.63) suggests buyers are taking profits.
Short-term reversal likely in play.
First Reaction Zone:
0.236 Fib at $533.87 is the first potential bounce zone.
Aligned with:
Fair Value Gap (FVG)
Upper range of the Weekly Order Block (OB)
Deeper Demand Zone:
If $533 fails, the Weekly Order Block becomes critical.
That zone stretches down toward $520–$508 (Fib 0.382).
Strong historical reaction area — may attract long setups if macro aligns.
RSI Divergence Risk:
RSI shows some signs of flattening.
Still above 59, so momentum is intact — but weakening.
📉 Pullback Path (Base Scenario):
Potential move to $533 → $520, consolidating inside the order block
From there, bullish continuation back toward $575+
Invalidated below $500, where structure breaks
📈 Mid-Term Bullish Bias Intact
Strong uptrend, higher lows still in place
Any dip into the OB + FVG zone = buy-the-dip opportunity.