QATAR STOCK MARKET INDEX - GNRI - Since years we are still in correction in a long years called Double Three Correction, until today we are in the last side of the DTC in side ((Y)) in Triangle in side D of it which looks soon trigger up to levels between 13.000 - 13.685 , and could reach up to 14.000 points .
Market Maker suppressed and put pressure on most or lets say 90% of the most of the stocks and accumulate as much as he can until today 22/04/2025
Most of the Stocks will be in freedom soon future (MAX. 6 Months)>
it seems to me most of the stocks will goes 200 % - 300 % specially the stocks under 1 riyals in its present price .
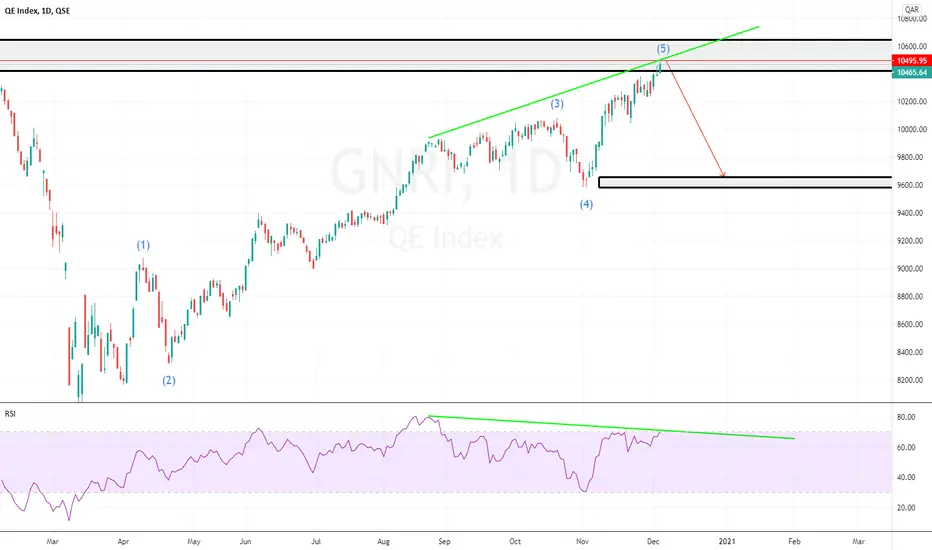
GNRI trade ideas


QATAR stock market QE index. Bullish rising wedge?Following on my previous bullish outlooks on the United Arab Emirates and Saudi index's
I figured why not examine what's going on in other parts of the region.
And lo behold Qatar also appears to be a major bullish stance.
You can see the positive market structure
and also a potential rising wedge in formation.
Let's keep an eye on this index over the coming years.

QE Index, LONG Harmonic Pattern AB=CDAB=CD Harmonic pattern is formed
Targets are as shown on the chart


GNRIComleted Harmonic Pattern ((Deep Crab))
((For long term)) We are expecting bounce which could reached to the targets shown on the chart.

GNRI- Qatar Draw a prediction chart for the Qatari stock market index until June 30th, and predict the market movement on an Daily time frame."
Good luck
M.zaid

GNRI Long term analysis As you can see from the chart the historical trenline from the year 2000, recently the trendline have been tested when the index dropped to 9600.
I'm observing the following :
1- Alot of people calling for 8000 (2020 bottom).
2- Monthly RSI in oversold territory.
3- Alot of Qatari stocks is trading at lowest historic prices.
Usuallly the following occurs historically:
1- Market usually move in the direction that most people don't expect.
2- Oversold monthly RSI market the bottom historically.
3- If you believe the index is going to 8000, you are betting against the historic trendline & Qatar economy.
4- 13k ~ 14k have been tested 4 times which means it became weaker, next time it rally it "may" break 14k resistance and rally further to new all time high.
Historicaly at these market and technical conditions it was a great long term buying opportunity.
Finally this is not financial advise.

BUY GNRIDear Qatari traders, as you can see on the GNRI 30min chart, the price pulled back numerous times before managing to make a fake breakout to come up and follow the VWAP on its way up.
TP and SL set them at your own risk!

GNRI - QE INDEXMonthly chart of QE Index
9482 is a strong support.
Still a down trend channel!
Needs to break the channel with a strong volume.

QE General Index Rebound sweet zoneCup & Handle breaking while bullish bat showing decent chance to make a higher bottom than July one
making sense that we're drawing a triangle >> boring period ahead

QE Index forming Symmetrical Triangle in Weekly ChartIn the last week, the market has been flat trading in the range of QAR 13350-12750, Where Real Estate sector has been dropped by 8.7%. looking into weekly time frame chart we have seen Symmetrical triangle formation. we may see slightly downside movement in #QE Index, As of now QAR12500 and QAR 12000 could be the initial supports for #Qatar Index. we have also seen the international markets like United States, China, Denmark has experience the biggest drops in last week.