GNRI .... Long INDEX Target between 12048 - 12720Bump and Run Reversal Top ( PARR ) pattern could be stablished previously and during next couple of days >>>>> Bump stage expected to be started within a week to 10 working days from Now.
GNRI trade ideas

QE Index - Short term vs Long term (RL & SL)As a price moves up and down on charts, it encounters “barriers” along the way. If a barrier acts like a floor and keeps the price from dropping any lower, then it is known in trading terminology as support. When it acts more as a ceiling and stands in the way of upward moves, it is called resistance...
Source:bforex

QE Index - Bears are exhaustedInsyaallah, MA50 x MA200 should cross soon. Will give us the 1st golden cross since Feb...indicates the underlying strength.


GNRI Qatar Exchange between Butterfly and Deep Crab
Butterfly rules said AB must be 78.6
Deep Crab rules said AB must be between 38.2 to 61.8
until now is Butterfly is going to go down more to be Deep Crab or not /


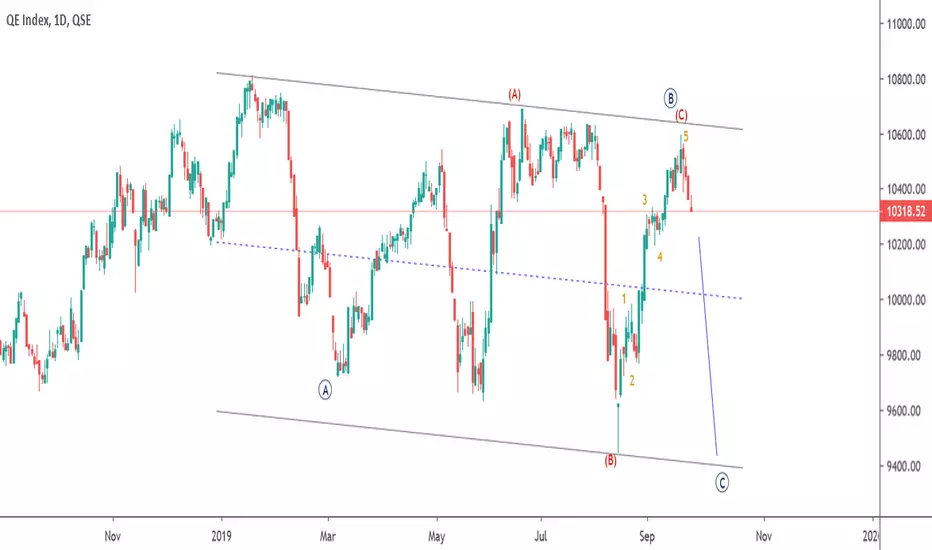
Qatar Index GNRI After did swing high I looking to short to 9778 to the support for ending the wave after that looking reversal pattern to long.


QE Index to reach 11,000 by year end ??Thu 06.Dec.2018 14:40
LAST= 10,598.40
QE Index movement during the last few days showed a Bullish move, with a recent high price seen on Wed 05.Dec.2018 at 10,632.89.
During the next few days the price is expected to go up to retest the previous high of 10,632.89.
The Short-Term view is expected to continue to be UP as long as the price is above 10,300,and its recommended to ' BE LONG ' for a targeted price of around 10,800 taking in consideration the resistance levels.
On the other hand, a change in the direction of the general trend needs to be considered when the price trades below the level 10,200
Res_2 = 10,720.
Res_1 = 10,650.
Sup_1 = 10,570.
Sup_2 = 10,490.
