short position on QIIKMy strategy is based on price action with the reading of certain indicators that I like while respecting all the values that define the stock maket
QIIK trade ideas

QIIK: Trading range situationas you see on the graph there is a balance between buyers and sellers. We really don't have a real trend. However, if the resistance line and the vwap are forcefully broken by a large green candle and followed by a large green volume it means that we would have a very high probability that the market will go higher. Therefore you enter a buy position as soon as the second green candle appears for more insurance. Furthermore, the market can also go down if and only if the vwap and the support line are forcefully broken by a large red candle and accompanied by a large red volume. So you can enter a sell position as soon as the second red candle appears for more insurance.Thanks!
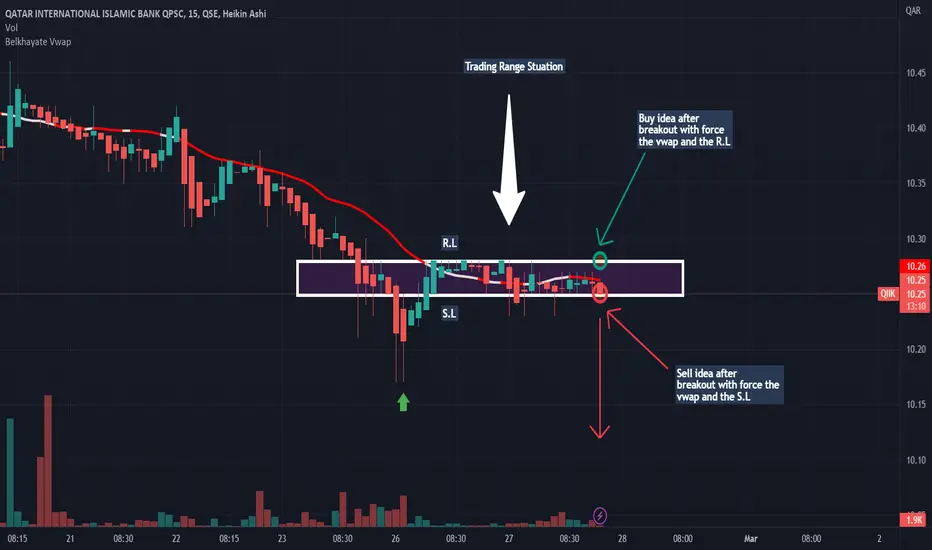
Buy ideaWe have a buy idea because we have the breakout of the resistance line and the vwap indicator by the buyers. Thanks!

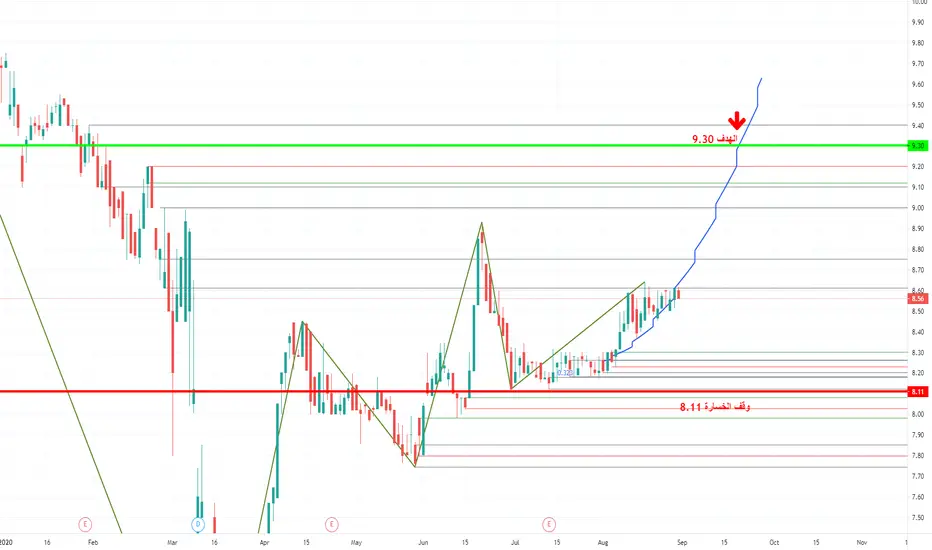
forecasting QATAR INTERNATIONAL ISLAMIC BANK in dayli chartGOOD START TO THE WEEK FRIENDS INVESTORS, I present to you a very interesting opportunity for those who have a fairly large wallet, as you can see in the graph the stock is breaking a strong trend line and due to my studies the stock can reach higher levels the next days and week

bull flagwith great results this quarter we can expect this bull flag to break upwards inshallah. we could go back to the red line where there seems to be some heavy resistance.

falling wedge We seem to be forming a falling wedge on the daily chart. this could possible take us back up to 9.5 or back down to 7, however there seems to be a heavy resistance at around 8.3 where the red line is placed. just keep in mind that a falling wedge is a bullish pattern.