QTUM/BTC [SHORT - MEDIUM] | BUY for %7+ PROFITOur indicators give buy signal!
Entrance : 0.00219650 - 0.00221869
Profit Points : 4% - 7% - More
Stoploss (Optional) : 2104
Stay tuned! Follow us for more signals.
Disclaimer: This is not a trade advice, every trade is at your own risk.
QTUMBTC trade ideas


QTUM - Time to Buy - 100% Profit Potential!!!Hello everyone and thanks for viewing.
Let's get right to it!
QTUM broke out on March 19th and has yet to rally past its' month high.
Accumulating for a month now, QTUM won't be left behind next alt run.
My trading strategy on Binance
Buy up to 0.0022
Target 1: 0.00263 20% profit
Target 2: 0.00329 50% profit
Target 3: 0.0044 100% profit
Stop Loss 0.00187
Rating : 4/5 4 stars!!
Volume 1200 btc


QTUMBTC Resistance/Support AnalyzesVery simple Technical Analyzes showing us how the price of QTUM reacted at current Support/Resistance lines, and what the reaction was.
I like simple.


QTUM-I've got my eye on youQtum is sitting on the 50 ma on the daily, sitting near the bottom of the ichi cloud, has falling sell volume and painted a very nice picture. You can see where the crowd on the side was waiting to buy the breakout of the falling triangle and the bears have pulled claws out. IF we hold the ichi cloud support I expect a nice bounce and uptrend resuming here.
Comment which direction you think it will move and why?

QTUMSome may see this as a cup and handle that so many coins are showing right now (since 21st March). However the volume profile doesn't match as well as I'd like... the volume was very strong pushing up to the left hand side with a lot of sellers falling out as the price then fell to the bottom of the 'cup'. However the volume pushing up into the right hand side is weaker in comparison and it may not (yet) have the strength to complete the pattern to the target (potentially at 38.2% fib 3160).
For the short-term - with the RSI overbought and regular divergence on the 4 hour and also on the MFI, plus bearish hidden divergence on the 1 day RSI (although this is lower than I would prefer for a hidden starting just over 50), I would normally expect a retrace. However the 1 hour RSI already had a strong correction and is showing bullish hidden divergence which may allow the price to make another jump possibly to the 2500 mark at the 23.6% fib.
Mid to longer term - There was a lot of support earlier this year when the price was in the 30-40k region, however there were also frequently sell walls stopping the price from exceeding 40k. We certainly have the volume to support moving higher and likely many holders in that upper region ready to sell! In contrast there were few sellers in the zone between 2500 and perhaps 3150 so with a bit of an increase in volume I would expect a swift move up with demand exceeding supply through the area.


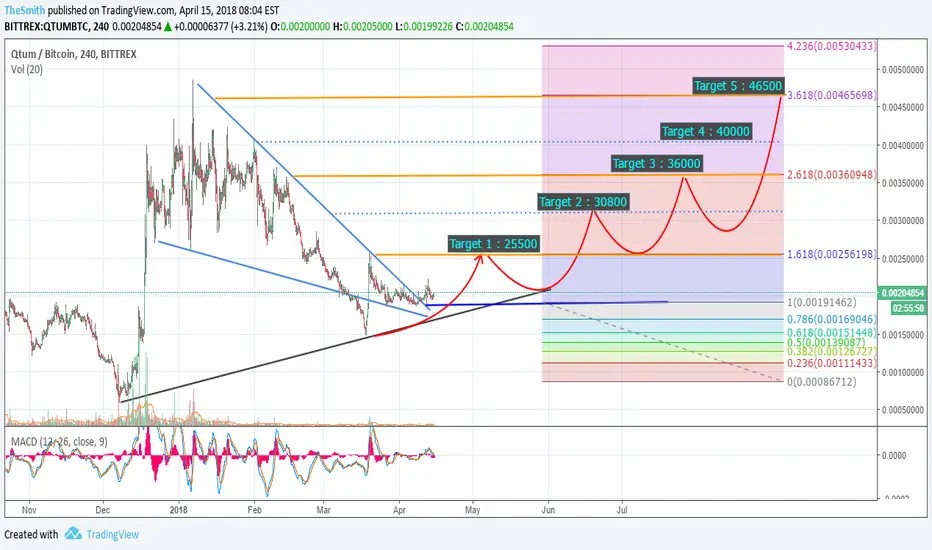
QTUM | Next move with sidewayIn chart 4h. We can see Chart Qtum look good
Qtum also good coin with support binance same top altcoin
Qtum/USDT
Qtum can breakout triangle Pattern and MACD for long-term
Buy order : 0.0020
Profit
(1) 0.00224
(2) 0.00255
(3) 0.00308
(4) 0.00360
(5) 0.00400
(6) 0.00465
Stoploss : 0.0018
Good Luck Everyone
Thanks
QTUM/BTC Bittrex 1h candlesHi, i checked situation about Qtum and graph looks like soon will be going up... dont you think? :)

QTUM ready for rally?Hello Friends,
With QTUM gaining support around 200000 SATs and BB squeezing , breakout of this range can give 100% returns.
Remembers my last call on QTUM gave 6x.
Please note: This is my trade, not a recommendation. Please trade at your risk.
QTUM +30% SWING PLAY$QTUM has been ranging for awhile now, and is testing the upper resistance atm. BB/ketlner squeeze + strong RSI and momentum are hinting at a breakout soon. R:R is nice in this spot as 0.328 fib has held 6/8 times. Target is the 1.272 fib and Ichimoku cloud flat ceiling.

QTUMBTC the price is breaking strong resistanceThere was a significant impulse growth and volume increase on 19th of March, then the coin went in the side trend for about a month and has met the lower edge of Ichi cloud which is formed by a green line. Moreover, triangle finishes at this point. Indicators are positive volume is increasing and it seems that the price is ready to break through this strong resistance. This will start another impulse growth to the upper edge of Ichi cloud and a quick break through it till our targets.

A new beginning... ?....or just a trap?
QTUM looking good as it seems to exit the wedge. Also the price is above 19.5 mBTC. (This price range has some historic importance.)
It is too early to call as certain. But if you're willing to bet some then this is a good candidate IMHO.

Qtum Bullish TA RoadmapAfter reanalysis and count wave, I come to conclusion is going to bullish soon
-61.8% retracement recent swing
-1:1 range breakout hit target to bottom
-Volume increasing and indicator bullish sign.
I will load a bag to stack and long hold, one of my favorite project regarding FA view.
TRADE with RISK MANAGEMENT!!!
I am an individual trader, based on personal analysis.
Welcome to share your ideas and let's improve it!
Looking for accountability partner in the trading journey and grow as professional trader.

Placed three positions VEN/BTC, ADX/BTC,QTUM/BTC - get some!Hello Fellas,
did this right one to get VEN, ADX and QTUM on my Madhatter trading list. Placed all my positions with a rebuy and sell target.
Let's see what today's market will bring.
Good luck trading,
bitcoin-089

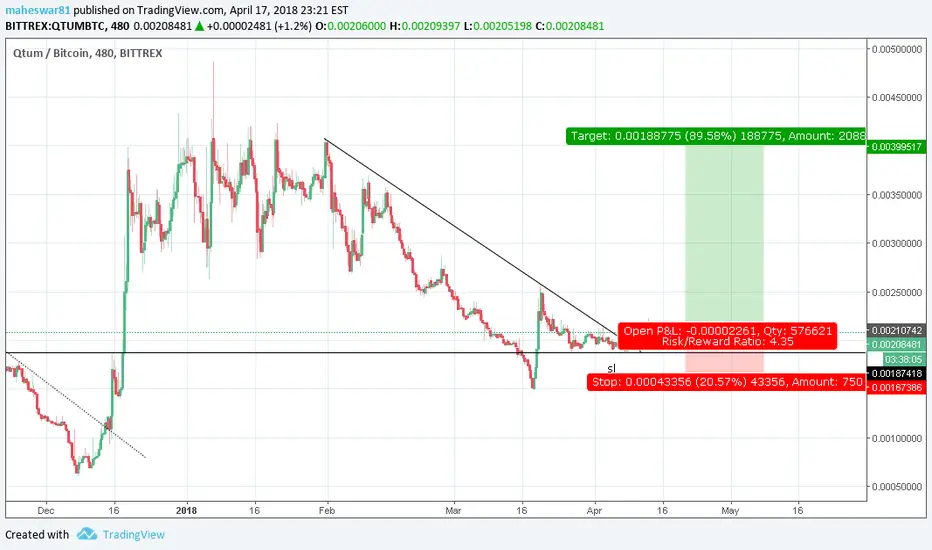
QTUM / BTC Scalp opportunityGood afternoon folks,
Today's trade I'm looking at QTUM. I have entered a position @ 2077, I am expecting a re-test of 0.0022 at the minimum and will either take profit, or adjust targets if wave 3 is confirmed.
Key Notes:
1) Daily RSI is at the resistance, volume needs to enter this coin very soon.
2) We have painted an 'ok' bull flag.
3) Observe the EMA crossings on the daily
4) Squeeze (essentially bollinger bands) shows a large move is about to happen.
5) The 1 hr/4hr charts are beautiful, we need to be mindful of the 0 histogram MACD rejection on the daily however.
As always, if you find my information helpful, please support me by hitting the like and follow button.
Upon 15 likes, I will continue to update this idea.


QTUMBTC: Ready to moveHi Friends, here is another TA for QTUM. I have used Three line brake chart.
Three Line Break charts show a series of vertical red and blue lines. Blue lines represent rising prices, Red lines portray falling prices. Prices continue in the same direction until a reversal is warranted. A reversal occurs when the closing price exceeds the high or low of the prior two lines.
TS-9 is changing its direction
Good luck
Thank you

Qtum/BTC Breaks resistance
Fact 1: Qtum is a top 20 currency with good fundamentals and a huge & active community
Fact 2: For 2-3 weeks now the price was in a sideways move in a channel with a strong resistance at 0.00210 and support tested twice at 0.00188
Yesterday a breakout of the resistance happened. Why I like it:
a. It was happening with significant volume
b. It happened after the Bitcoin crazy run so a coin recovering so fast, it's one which has some bulls behind it.
c. It is retested as we speak with lower volume
I would enter around 0.00218 with the first target at 0.00250,a healthy 14% profit. Still, I really think this one can go much higher of the volume from mid-March will come back.

QTUMBTC: ARE YOU READY?Hello friends,
QTUM already accumulated for a while, It's looking pretty good right now, if it's able to break the wedge with a decent volume it's definetly going up.
Also RSI is acting as support at level 50.
I set my stoploss just in case the wedge gets invalidated.
- THIS IS NOT FINANCIAL ADVICE -

QTUM: Getting ready to take off soonHello fellas, Qtum will moon soon. This is the time to load it. It will start moving within 2-3 days. Lets wait for the RSI to come down a bit. However, We can buy here.Please make sure you use stop lose.
