QTUM! PARABOLIC SELL OFF **UPDATE**RSI is oversold, so there is the potential to play the bounce, however it is too risky in my opinion, unless you have to motivation to do so. So as listed in my other QTUM chart, except now "updated" to fix the chart text TYPO...I have been expecting a bullish reaction here at the 61.8% Golden Zone, where YES, we can see we have found nice support...for the time being, but obviously the correlation with Bitcoin is strong, as it is with every other coin.
CURRENT STRATEGY.
I'm going to wait and see. We can see previously, we basically double bottomed, and are on our way back down, so I would ABSOLUTELY NOT enter a long position until I see what happens, if and when we reach the lower fib targets.
If we punch through the Golden Zone, then watch the reactions at 78.6% and the 88.7%. But I'm watching from the sideline until we see confirmation of a reversal.
Thanks
**NOT FINANCIAL ADVICE, JUST SHARING WHAT I SEE.**
QTUMUSD trade ideas

QTUM! DON'T GET CAUGHT IN THE REDShot in the dark prediction for Qtum going off the data we've got, unless there a fundamentals at play, Qtum is so closely correlated to Bitcoin, you may as well watch the BTC chart. Green boxes are entry points I'm watching...I wouldn't enter now unless Bitcoin is bullish.
It's internally working its way up, trading in the channel (black trendlines), from what I see, its in the middle of its wave 4, before an impulse up to complete its wave 5. We see a reaction off the 50% to the tick, but it doesn't look strong enough to hold. I know there'll be a reaction at the 61.8% if we get there. A touch down at the 78.6% would require hard sell side pressure, and anywhere lower all bets are off.
At the moment im watching to see if we have an ending diagonal at play, but it does look bullish, as it is trending up, and it does look like its on its wave 4. So I WOULD NOT buy in yet, until I either reach my targets, or BTC makes a bullish move and QTUM decides to follow.
**NOT FINANCIAL ADVICE, JUST SHARING WHAT I'M SEEING**
Thanks

QTUM !QTUM/USD pennant into the uptrend channel
Now in the resistance price-zone.
Targets
28$ (25% profit from now)
33$ (45%)

Qtum rally ? Btc making text book patterns. No candles required. Confluence with other crypto assets
give potential indication of next price points. Here we have conflict.
Btc forming a bearish yet to complete head and shoulders pattern. There is no confidence at this point.
However Qtum has broken past the last high. on this time frame. Without btc making a positive move. Qtum will
continue to consolidate. Caution, the break out must have conviction. No trade, as there is no signal.

QTM in flag?QTM has left the ascending trend channel and entered a bullish?? flag - where it tests the lower limit actually.
If the limit is broken then the next support would be 19,20$ - a swing trend line. It seems that this support is strong - and it should halt.
In the case the upper limit would be broken - the next resistance is near and even when crossed to the top, the next fib retracement (27.30$) is also around the corner.
You see the two possiblities in green or red.
As the testing of the lower limit hasn´t ended yet we´ve to wait and to be patient.
For other coins as BTC and ETH I expect an ABC correction - so if QTM follows the trend and if I´m right - the probabiliy of a downtrend is higher than the uptrend.
conclusion: more probability for short than for long

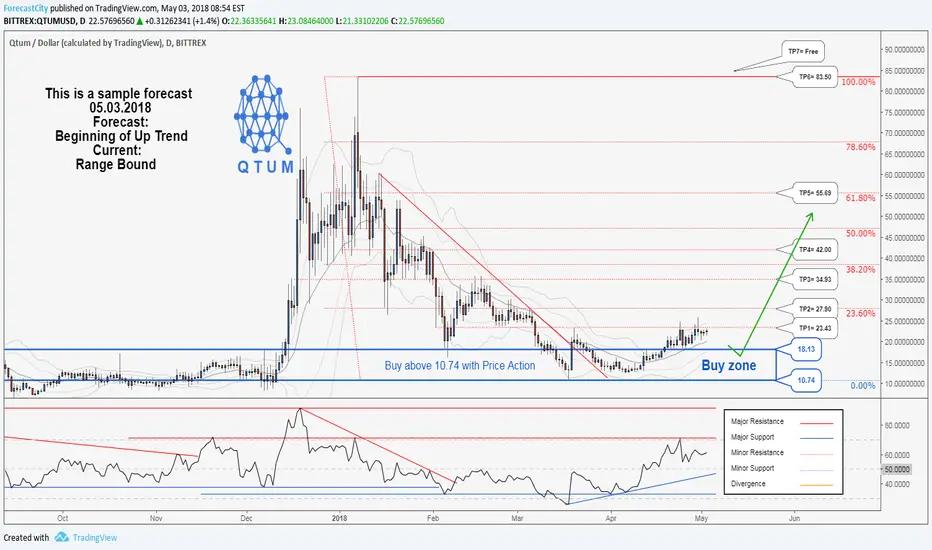
There is possibility for the beginning of uptrend in QTUM ...Technical analysis:
QTUM/DOLLAR is in a range bound and beginning of up trend is expected.
The price is above the 21-Day WEMA which acts as a dynamic support.
The RSI is at 60.
Trading suggestion:
The price is in a range bound, but we forecast the uptrend would begin.
There is possibility of temporary retracement to suggested support zone (18.13 to 10.74), if so , traders can set orders based on Daily-Trading-Opportunities and expect to reach short-term targets.
Beginning of entry zone (18.13)
Ending of entry zone (10.74)
Entry signal:
Signal to enter the market occurs when the price comes to "Buy zone" then forms one of the reversal patterns, whether "Hammer" or "Valley" , in other words,
NO entry signal when the price comes to the zone BUT after any of reversal patterns is formed in the zone.
To learn more about "Entry signal" and special version of our "Price Action" strategy FOLLOW our lessons:
Take Profits:
TP1= @ 23.43
TP2= @ 27.90
TP3= @ 34.93
TP4= @ 42.00
TP5= @ 55.69
TP6= @ 83.50
TP7= Free
Qtum Bullish in the 4 hr hr timeframeMacd going to the positive
RSI ticking upside
EMA is also bullsih

QTUM - Buy Opportunity NowHi All,
Trading QTUMUSD we have a good looking chart on both the 4 hour and daily time frames
EMA's: On the daily chart we had the 55 cross above the 200 a few days back. And now the 55 is about to be crossed to the upside by the 9,13 and 21 EMA's. Very bullish sign.
RSI: Looking bullish to me by making higher lows. See the trend line in yellow on the chart.
MACD: We have just crossed over into positive territory and have some nice bullish divergence happening. Plenty of room for this puppy to run.
I've bought in at $19.50
Stop Loss: $16
Target: Minimum 20% profit target with this trade. Ideally 30% or higher.
BITTREX:QTUMUSD BITTREX:QTUMUSD

QTMUSD #QTMUSD
Market capitalization:1 296 833 000 dollars. 24H:80 700 000 dollars.
On the timetable D1 pair is at a price tag of 12.6 .Key levels: Resistance:21.5; Support:10.5;
Consider scripts
At the moment, the price is in the range 12.6-12.7. The The currency pair is now in a downtrend over the past 7 days, the price has dropped by 9%.If the price continues to fall, then the first target will be 10.5. To talk about purchases, then the price must break through the channel and become stronger for further movement up to 22.

QTUM/USDPrice is outside the traingle-pattern.
Need breakout important accumulating zone to
continue rising. Use Fibo lvls as targets.

Qtm/usd is about to buy.
Hello friends,
if the price goes out of the small structure its means bull get started.
This is one of the good trade getting ready for me.
because of the risk vs reward very satisfactory.
QTUM also wonderful project.
We got a sharp impulse left side of the chart
& huge correction also playout after the impulse.


QTMUSD Analysis 2018-03-27$QTMUSD :4HR: Long term downard trend levelling out. Price, TK lines, Chikou below Kumo. Fib retracement 0.5 failed. Possible small downward trend into reversal soon? #KazukoTradeKazoku #KTK #Bitfinex #TradingView

QTMUSD# QTMUSD
Market capitalization: 1 615 771 000 $ . 24H:246 065 000 $ .
On the timeframe D1 pair is at the price level of 18.2 dollars. Key levels: Resistance:33 ; Support:11 ;
Consider scripts
At the moment, the price is in the price range 18.2-18.5.Para is now in a falling trend, but over the past 7 days the price has increased by 20%. To view purchases, the price must break through the trend line to get stronger and only under such conditions you can consider purchasing up to 32.If there will be a rollback, then the first target will be in area 11.

QTMUSD# QTMUSD
Market capitalization: 1 518 428 000 $ . 24H:476 301 000 $ .
On the timeframe D1 pair is at the price level of 20.5 dollars. Key levels: Resistance:33 ; Support:11 ;
Consider scripts
At the moment, the price is in the price range of 20.0-20.5. The bar is now in a declining trend that tells us when approaching prices to important areas.Or trendlines are more likely to have the price.
To view purchases, the price should be fixed higher than the level of 20, and only under such conditions, you can consider purchases of up to $ 30. If you roll back then the first goal 11.


We're still downtrending!what is happening to Qtum is happening to a lot of coins.
We've seen a nice pump and everybody is positive we will be seeing higher highs again!
BUT........
before we know we will be seeing higher highs we have to break the upper trendline of the drawn channel.
If it it breaks the trendline it is a conformation we will be seeing higher highs again.
If it tests the trendline and Qtum fails to break it , we will continue the current downtrend


Possible QTUM movementsOf course, the movement would depend on BTC but QTUM has its own levels and they should be respected.
