Don't miss the great buy opportunity in QTUMUSDTrading suggestion:
. There is a possibility of temporary retracement to suggested support line (1.97). if so, traders can set orders based on Price Action and expect to reach short-term targets.
Technical analysis:
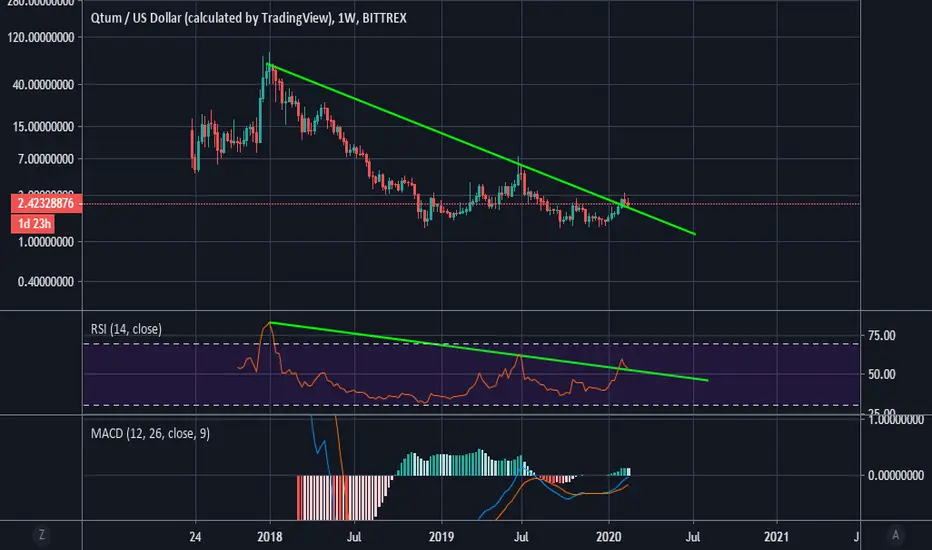
. QTUMUSD is in a range bound and the beginning of uptrend is expected.
=.The price is above the 21-Day WEMA which acts as a dynamic support.
. The RSI is at 70.
Take Profits:
TP1= @ 2.35
TP2= @ 2.70
TP3= @ 3.00
TP4= @ 3.65
TP5= @ 5.00
SL= Break below S2
❤️ If you find this helpful and want more FREE forecasts in TradingView
. . . . . Please show your support back,
. . . . . . . . Hit the 👍 LIKE button,
. . . . . . . . . . . Drop some feedback below in the comment!
❤️ Your Support is very much 🙏 appreciated! ❤️
💎 Want us to help you become a better Forex trader ?
Now, It's your turn !
Be sure to leave a comment let us know how do you see this opportunity and forecast.
Trade well, ❤️
ForecastCity English Support Team ❤️
QTUMUSD trade ideas

Don't miss the great buy opportunity in QTUMUSDTrading suggestion:
. There is a possibility of temporary retracement to suggested support line (1.97). if so, traders can set orders based on Price Action and expect to reach short-term targets.
Technical analysis:
. QTUMUSD is in a range bound and the beginning of uptrend is expected.
=.The price is above the 21-Day WEMA which acts as a dynamic support.
. The RSI is at 70.
Take Profits:
TP1= @ 2.35
TP2= @ 2.70
TP3= @ 3.00
TP4= @ 3.65
TP5= @ 5.00
SL= Break below S2
❤️ If you find this helpful and want more FREE forecasts in TradingView
. . . . . Please show your support back,
. . . . . . . . Hit the 👍 LIKE button,
. . . . . . . . . . . Drop some feedback below in the comment!
❤️ Your Support is very much 🙏 appreciated! ❤️
💎 Want us to help you become a better Forex trader ?
Now, It's your turn !
Be sure to leave a comment let us know how do you see this opportunity and forecast.
Trade well, ❤️
ForecastCity English Support Team ❤️


QTUMUSD IS BULLISH wit 21% profit targetQTUM is one of the rare coin that don't double it vaue since the last BTC Dump.
It is moving in parralel channel and is about to break it up with 21% profit. As you can see, there is a strong resistance line that will probably stop the move so it will be our target.
The reversing stochastic is also a good sign of bullish movement.
------------------------------------
Good luck
PS: Have a look on my other analysis maybe you'll find a good opportunities

QTUMUSD - No Man's LandI will share my thoughts on the current market situation and any possible targets. You can make your conclusion out of this and make your own decision how to play it!
QTUMUSD: On the 1 hour chart; side way action in a ascending triangle pattern. This can lead to continuation to the downside or break bullish. We need to wait for a pattern break. On the higher time frames we are just searching for a lower high to be set.
As always, patience is key.
Would you like to see more of my ideas? Please give me a follow. Thanks for your support!


QTUM about to throwback?After a few days of consolidation within this range and after a breakout of the range resistance. I believe the price is making a throwback that may reach 0.5 ~ 0.61 Fibonacci, just before continuing with the new uptrend.
If all this happens I think that a target in the $2.35 is more than valid, and perhaps too conservative.
Am I wrong? ...will see! ✌️

QTUMUSD - accumulation above old trend lineQTUMUSD - accumulation above old trend line.
RSI bullish. Long

Qtum Price PredictionBINANCE:QTUMUSD
The Qtum price can go up from 1.661 USD to 4.121 USD in 14 Days
The Qtum price can go up from 1.661 USD to 5.990 USD in 3 Month
Information provided is only educational and should not be used to take action in the markets!


QTUM (QTMUSD) short.All description on the chart.
Please, don't forget to like and follow.
Thank you.

Qtum (QTMUSD) long.All description on the chart.
Please, don't forget to like and follow.
Thank you.

QtumUSD WeeklyFor my own reference
- Like other Alts, Many guys already had gone.
- It had made a brutal new historical low with many guys' tear drops.
- Weekly candles looks like it's forming a falling wedge.
: I hope it can make trend reversal here or at the end of the pattern.
Take your own risk & get some money.


Qtum Price Analysis QTUM / USD: Pattern SuperpositionQTUM / USD Short-term price analysis
QTUM has a bearish short-term trading bias, with the cryptocurrency still trading below its 200-period moving average on the four-hour time frame.
The four-hour time frame shows that a bearish head and shoulders pattern is starting to form, which could trigger the next bearish move lower in the QTUM / USD pair.
Technical indicators on the four-hour time frame have turned bullish and continue to generate buy signals.
QTUM / USD H4 Chart by TradingView
Pattern Watch
Traders should note that a bullish double-bottom pattern is also in play across the four-hour time frame.
Relative Strength Index
The Relative Strength indicator has turned bullish on the four-hour time frame and is generating a buy signal.
MACD Indicator
The MACD indicator has turned bullish on the four-hour time frame, with the MACD signal and histogram both issuing a buy signal.
QTUM / USD Medium-term price analysis
QTUM has a neutral medium-term trading outlook, with the QTUM / USD pair probing towards its trend defining 200-day moving average.
The daily time frame is showing that the QTUM / USD pair is at a critical juncture over the medium-term, as bulls and bear battle around key technical support.
Technical indicators on the daily time frame are bearish and continue to generate sell signals.
Pattern Watch
Traders should note that the large inverted head and shoulders pattern still remains valid on the daily time frame.
Relative Strength Index
The Relative Strength indicator remains bearish on the daily time frame and continues to issue a sell signal.
MACD Indicator
The MACD indicator is bearish on the daily time frame and continues to generate a sell signal.
Conclusion
QTUM is at a critical juncture over both short and medium-term, as bulls and bears battle for directional control around the QTUM / USD pair’s 200-day moving average.
The four-hour time frame best illustrates the near-term struggle, with a head and shoulders pattern pitched against a double-bottom pattern.
