QTUMUSDTHolding a major support of 16.40 and is likely to head further up from here. On back of multiple break-outs QTUM is lining up for another Leg targeting 24-25.
19.10 is likely to a give resistance however surpassing this would pave path for a smooth sail towards eventual Target.
QTUMUSDT trade ideas

QTUM/USDT (Interval 1D) Cup & HandleI have drawn Cup & Handle using down-slopping trendline for early entry, Looks like this will breakout.

QTUM USDT X3 perp Working out the "DIAMOND" patternI propose to look at I give a coin not only from the side of trade, but also from the side of a small investment. Looking at the large timeframe, you can see the "diamond" pattern
A pending order to buy in the zone I have designated.
Stop loss and target values indicated on the chart

QTUMUSDT AnalysisHello friends.
Please support my work by clicking the LIKE button(If you liked).Thank you!
Everything on the chart.
open pos: market and lower
target: 16 - 20 - 23
after first target reached move ur stop to breakeven
stop: ~9.2(depending of ur risk). ALWAYS follow ur RM .
risk/reward 1 to 3
risk is justified
Good luck everyone!
Follow me on TRADINGView, if you don't want to miss my next analysis or signals.
It's not financial advice.
Dont Forget, always make your own research before to trade my ideas!
Will be very APPRECIATE FOR UR DONAT/coins :)
Open to your questions or suggestions(Looking for investors!).

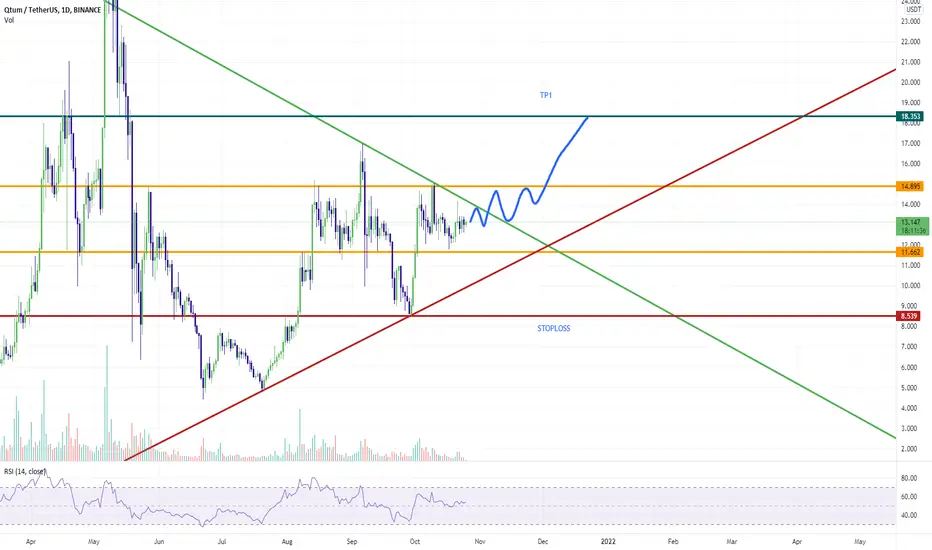
Qtum QTUMUSDT Bullish Flag Pattern Fib levels LONGQtum which I like to think as Quantum :) "replaces traditonal contracts between parties, build Decentralized applications, trustless transactions between parties, freedom of payments, counterfeiting impossible, fraud resistant, combining a modified Bitcoin Core infrastructure with an intercompatible version of the Ethereum Virtual Machine (EVM)", (by Coincheckup)
I based my analysis on a bullish flag pattern, marked possible T/P positions 1 and 2 where I would close my position between 50-75% and hold the remaining to reach T/P 3. S/L as indicated by RED.
The Pattern T/P is supported in addition by Fib levels measured from the highest point of the price ever reached to the drop.
Trade carefully, protect your capital- this idea is just an idea not a trading advise!

#QTUMUSDT Risky (Long Term) 10/21#QTUMUSDT Risky (Long Term)
Buy : 13.75000000 - 11.77756594
Target 1: 14.22500000
Target 2: 18.56250000
Target 3: 24.06250000
Target 4: 34.37500000
Stoploss: 11.47595728
Signal R/R: 10% / 150%
Net ROI : 50%
Invest / Position Size : 3%
Exchange : Binance, Bittrex, KuCoin, FTX,
Duration: 15-90 days
Confidence in Trade: Low
we ask Allah reconcile and repay.
Last C&H for #QTUMUSDT make it pumped by +500% keep it in your watchlist!
🙏we ask Allah reconcile and repay🙏

QTUMUSDT Bullish | Strong Support Zone | Morning Star FormationQTUMUSDT Bullish from Strong Support Zone | Creating Morning Star
I am expecting a 17% move could be more than that and expecting a bull run till $36 which is 177%
Entry: 12.856
TP1: 15.039
TP2: 17.045
TP3: 20.971
TP4: 26.697
TP5: 35.664
SL: 11.589
Net ROI: 170% - 177%
Trade Risk: 9.86%
Duration: 3 Months
NOTE: Do your own analysis. Spot trading only. Take a low risk. I will not be responsible for any loss.

QTUM/USDT TRADE SETUP!Hello everyone, if you like the idea, do not forget to support with a like and follow.
Welcome to this QTUM trade setup. QTUM broke out from the falling wedge-like structure and currently retesting it. So I'm buying some here and adding more in the dip.
Entry range:- $13.2-$13.5
Target1:- $14.2
Target2:- $14.66
Target3:- $15.02
Target4:- $15.8
SL:- $12.78
Leverage:- 3x-5x
If you like this idea then do support it with like and follow.
Also, share your views in the comment section.
This isn't financial advice. DYOR before investing.
Thank You!


QTUMUSDT Daily - Breaking TriangleQTUMUSDT Daily Time Frame
Breaking Triangle after 178 day
and will be pump again ...
OPEN YOUR EYES!


QTUM / USDT . Risky idea …Awesome moment to collect some QTUM here 14-13 ❤️
Contact us for full info ✅


QTUM, breaking through the downtrend line.The following content is machine translation:
QTUM, breaking through the downtrend line.
Morphologically, it rose today, broke the downtrend line, and was bullish.
The indicator MACD directly rushed to the zero axis.
Treat with breakthrough success without diving and go long.

Bullish under one condition .!!On weekly chart I see Head and shoulder pattern formed .
Don`t buy QTUM under 14$ .
Safe zone , Price should close weekly candle above 14 $ - 14.5$
Buy gradually , don`t go all in .
Target on chart 20$
Good luck for all

Qtum 1D analysisHello to all
I am at your service with 1D Qtum analysis
best entry point
after breakout Triangular roof
Targets ( Around ):
1) 15$
2) 17.5$
3) 20$
4) 26$
Supports ( Around ):
1) 10.3$
2) 8.1$
3) 5.7$
notice : Rsi and Mfi are suitable area

QTUMUSDT - EW analysis - ABC zigzag upQTUMUSDT - The structure seems like ABC zigzag and will start 3rd of C up soon. Invalidation level is 10.719 low and above 14.697 high of 1st of C, it will extend further upside up to 21.

qtumIt is getting ready nothing conflicts btc pair supports this coins movement, last days spent without making noise it is her time.

Qtumusdt BuyHello traders!
Qtumusdt is now consolidating for a pump to 20+ target.
This pump can hit 22$ and then we will see a sudden drop from 22.
In my previous post i gave a new strategy and according to that if we set Fibonacci 0.618 at first bearish candle which formed after continuous bullish candles then we can figure out the next target and a drop point.
The next Target and a drop point is above 20$ which means we can gain 50% of the investment in this rise.
Don't forget to hit the like button and follow to stay connected.

QTUMUSDT 4H long setup; 4H 50MA regained above support zoneTA explained
QTUM regained support zone again and now trending above 4H 50MA, expecting more upward movement from here
Trade setup
Best entries: 13.005 - 13.455
TP1: 14.912
TP2: 16.037
TP3: 17.440
SL: 12.122
RR: 3.79
Max leverage: 2
—————
MDSquared Crypto Lounge
—————
Do Your Own Research (of course)
Trade at own risk (of course)
Only trade what you can afford to lose (of course)

Qtum (QTUM) in range for flip R/SQtum setup looks good for a HH.
Still in range now but everything looks good.
If QTUM flipped resistance in support.
Ichimoku (on the daily):
- Price above cloud
- Tenkan above Kijun
- Chikou above cloud
DYOR.
QTUMUSDTEstablishing a bull flag formation. Its likely to retrace towards 11.70-11.30 before continuation of trend. Once Price breaks and sustains above 13 once more will trigger a move towards 14.90 followed by 17.50.
However any closing below 11.30 would open 10.40 as next major support.

WYKOFF Re-accumulation Phase Underway??Here we can clearly see some form of Wykoff shaping up. Given overall market sentiment and fundamentals (with regards to regulation and ETFs) im biased towards being bullish. That being said im betting on this being accumulation rather than distribution.
On the 4H chart we see a slow bleed down below ST at SOW which spent some time around here under accumulation soaking up liquidity before quickly brought up by strong hands giving us a sharp rally (giving us a sign of bullish strength). we may see a small range before breaking out to the upside with a quick retest back into the liquidity zone formed at the fake-out of UA.
