Growth potential up to 900% based on the giant triangle patternI have been monitoring the price movement of this chart for about a week First, it broke the falling wedge pattern in the lower timeframes This led to the breaking of the triangle pattern which restricted price movements for four months then it pulled back and placed on the support area There are many support levels in this area The price is right above sma50, sma200 and ema200 I do not write much because no one likes to read ===================================================================================== There are several target : target 1 : fib 1.618 ( about 4 usdt ) target 2 : fib 2.618 ( about 5.5 usdt ) target 4 : fib 3 ( about 6 usdt ) target 4 : 25 usdt ( Based on the massive triangle pattern ) ===================================================================================== Sincerely, Little BobLongby BobRivera990Updated 448
Qtum maybe Support : 1.95 Res 1: 2.78 Res 2 : 3.06 Res 3 : 3.67 Ep: 2.26 Sl: 1.75 Tp: 4.10 Longby Cagarsl0
qtumusdtascending triangle formation in qtum usdt ....lets see whats happens ...expecting a good return as it is having neutron releasing on 31 december ....a big news for the qtum Longby shubhrantchaudhary0070
Big move coming up for QTUMUSDT?On the daily timeframe there is a long term downtrend resistance line (red line) starting from the 30th of April 2018 (!!!). Moreover QTUMUSTD broke the daily symmetrical triangle already and turned the resistance line into support. I expect a very big move up soon, similar what we have seen for coins like XRPUSDT.Longby olivierbrouwUpdated 223
QTUM possible drop to supportQTUM break out of falling wedge into a formation of a rising wedge. Harmonic pattern coming to a complete. QTUM looks like it is weakening and can break out of its trend support possibly. Shortby BigLava222
QTUMUSDT is testing dynamic weekly trendline 🦐QTUMUSDT is testing dynamic weekly trendline, and now the price is testing 4h structure. IF the price will have a breakout and turn the current 4h resistance into new support, According to Plancton's strategy (check our Academy), we can set a nice order ––––– Follow the Shrimp 🦐 Keep in mind. 🟣 Purple structure -> Monthly structure. 🔴 Red structure -> Weekly structure. 🔵 Blue structure -> Daily structure. 🟡 Yellow structure -> 4h structure. ⚫️ Black structure -> <4h structure. Here is the Plancton0618 technical analysis, please comment below if you have any question. The ENTRY in the market will be taken only if the condition of the Plancton0618 strategy will trigger.Longby InkyGripUpdated 131312
QTUM/USDTPERP - LONG - Potential 8.13%***NEW TRADE SET UP"** QTUM/USDTPERP - LONG - Potential 8.13% Optional Leverage: 3X Entry- 2.523 TP1(75%) -2.607 TP2- (25%) - 2.728 SL- 2.399 - BTC at strong point of resistance rejection possible - High Risk Trade with Small Targets/Risk - RR - 1.65 - Trailing Buy - 0.5% - Trailing Profit - 1% - Trailing Stop-Loss - NoLongby Kryptochristian3
QTUMUSDTPERP - Long - Potential 9.39%QTUMUSDTPERP - Long - Potential 9.39% Entry- 2.556 TP1- 2.664 TP2- 2.796 SL- 2.440 - Optional Leverage 3-5X - BTC Extremely Volatile - HIGH RISK TRADE - RR - 2.07 - Trailing Buy - 0.5% - Trailing Profit - 1% - Trailing Stop-Loss - NoLongby CryptoNicho1
QTUMUSDT - Descending triangleQTUMUSDT is printing a descending triangle pattern. Price is testing the pattern support. Possible price actions are indicated on the chart. by Chibuike_Odoh1
Qtum / Usdt - Fib Retracement DShort in short term long at 1.555 for long term according to fib retracementShortby samandadmandian0
QTUMUSDT|Range Low S/R|200 DMA|Declining Volume|PA|Stoch CrossEvening Traders, Today’s analysis – QTUMUSDT- trading in a defined range, Range Low has a probability of being tested, Points to consider, - Price Action Trending - Range Low Support (200 DMA & .618 Fibonacci, Confluence) - Range- Mid Resistance - Declining Volume - RSI Bullish Control - Stoch Buy Cross QTUMUSDT’s immediate price action is bullish above Range Low, back test and hold of the 200 DMA increases the probability of a higher low. Range Low S/R is support that is in confluence with the 200 DMA and .618 Fibonacci, back testing these regions allow for a risk defined entry. Volume is currently declining which is indicative of an influx, this usually occurs at key trade location such as the Range Low. The RSI is trading in its Bullish Control Zone, holding these regions are indicative of strength in the market. Current Stochastics has a buy cross coming to fruitions, confirmation will signify a momentum shift. The Range-Mid is current resistance, breaking this level with conviction will negate the trade idea. Overall, in my opinion, QTUMUSDT is a valid long with defined risk; price action is to be used upon discretion/ management. Hope this analysis helps! Thank you for following my work And remember, “Accepting losses is the most important single investment device to insure safety of capital.” – Gerald M. Loeb Longby AzizKhanZamani58
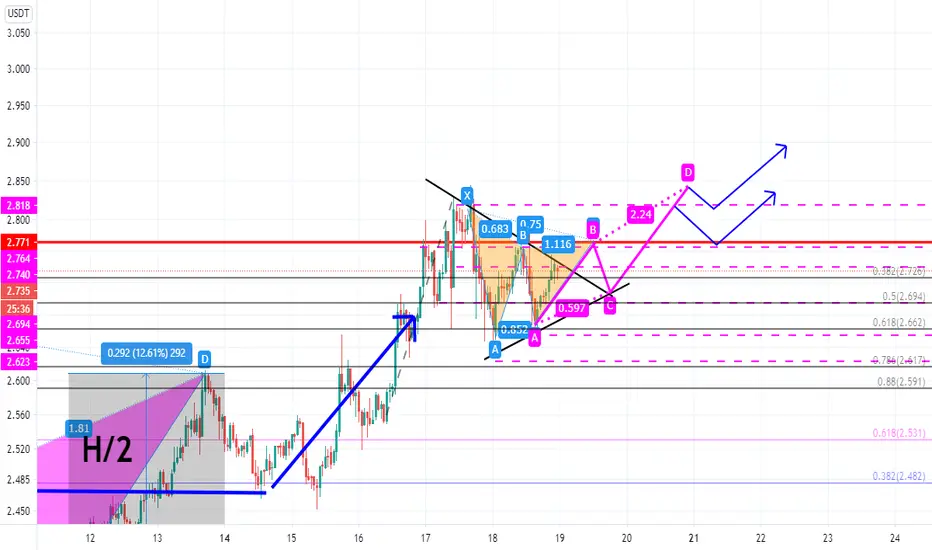
Qtum/usdtEverything is clear in the picture ... Be patient and pay attention to the power of the candlesticks and trade more carefully and try to work on shorter times. The market situation is sensitive .... Good luck👍✌by Moein_Haddadian220
QTUMUSDT is testing daily resistance 🦐QTUMUSDT is testing daily resistance and the price is creating a bull flag. IF the price will have a breakout and turns the current resistance as new support, According to Plancton's strategy (check our Academy), we can set a nice order ––––– Follow the Shrimp 🦐 Keep in mind. 🟣 Purple structure -> Monthly structure. 🔴 Red structure -> Weekly structure. 🔵 Blue structure -> Daily structure. 🟡 Yellow structure -> 4h structure. ⚫️ Black structure -> <4h structure. Here is the Plancton0618 technical analysis, please comment below if you have any question. The ENTRY in the market will be taken only if the condition of the Plancton0618 strategy will trigger.Longby InkyGripUpdated 101015