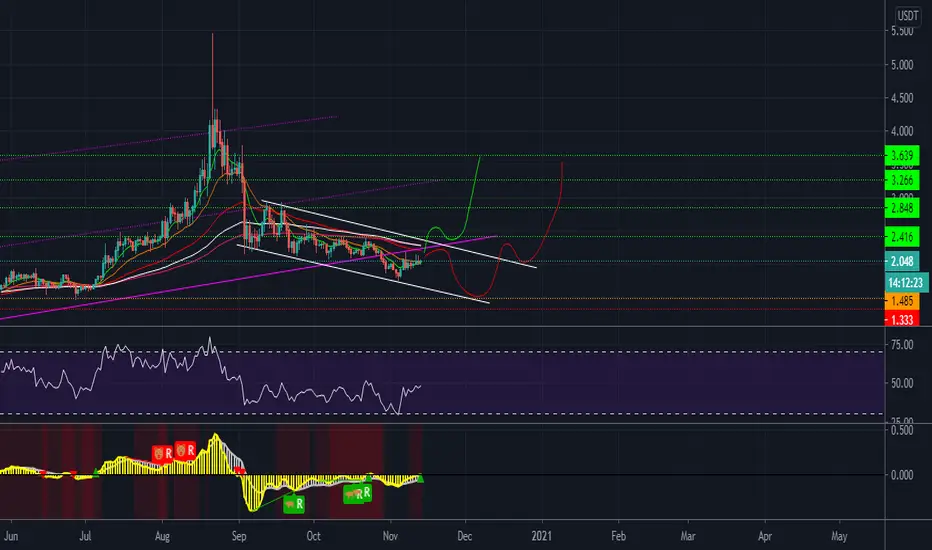
QTUM - USDTStrong resist is crossed line between white & purple ( its about 2.2 - 2.3 area )
Safe to OP Long if break that area or waiting at 1.4 - 1.5 ( this area is anticipating if BTC suddenly dump ), keep in mind that BTC has not shown a significant correction ( 1D Chart so far for BTC indicating is bearish divergence, and RSI look like making a H&S Pattern to the downside. But the whale keep pushing the price )
DWYOR
QTUMUSDT trade ideas
QTUM/USDTSmall 5% gain in the making for a short term trade. Wait for a break out of the resistance and retest for the bounce.

QTUM ABOUT TO BLAST WITH DEFI!!QTUM JUST A N N O U N C E D DEFI RELEASING TOMORROW!! MOON MISSION STARTING IN T-MINUS NOW!!! LETS PURCHASE!! THIS IS NOT FINANCIAL ADVICE!! THIS IS THE MAN... THE MYTH.. THE LEGEND ---- FRANK THE TANK ON THE MIC!!! Easy 10 Dollars and 4X on the Way!


QTUMUSDTPERP- Long - Potential 11.47% *NEW TRADE SET-UP*
QTUMUSDTPERP- Long - Potential 11.47%
Leverage Optional: 2x - 3x
Entry- 2.145
TP1- 2.233
TP2- 2.391
SL- 2.008
- WARNING - Higher risk trading conditions - short-term bearish BTC signs that could draw market down
- RR - 1.8
- Trailing Buy - 0.5%
- Trailing Profit - 1%
- Trailing Stop-Loss - No


QTUMUSDT - Elliottwave analysis - C wave upQTUMUSDT - It is in ABC zigzag move up, where C wave is in progress after B wave sideway correction. The 2nd is about to start moving down to give an opportunity for 3rd wave up of C. Stay bullish near 2.00 with stop level above 1.934 as stop level for target zone above 2.30-2.35 zone.
Give thumbs up if you really like the trade idea.


QTUMUSDT lost important daily support 🦐QTUMUSDT lost important daily support, and now the price is testing the local 4h support.
IF the price will have a breakout downward, According to Plancton's strategy, we can set a nice order
–––––
Follow the Shrimp 🦐
Keep in mind.
🟣 Purple structure -> Monthly structure.
🔴 Red structure -> Weekly structure.
🔵 Blue structure -> Daily structure.
🟡 Yellow structure -> 4h structure.
⚫️ Black structure -> <4h structure.
Here is the Plancton0618 technical analysis, please comment below if you have any question.
The ENTRY in the market will be taken only if the condition of the Plancton0618 strategy will trigger.

Qtum: bottom tested. Downtrend line brokenHi,
I’m a newbie on charting, dont be too hard on me :)
This is my analysis.
Thanks


QTUM at the bottom of the trendQtum has a lot of space to grow as it is nearly the same coin as ETH, or better said it can benefit from each and every update ETH makes. With the gas fees nearing extremes it makes sense that Qtum will start to siphon off some of the market cap that ETH has gathered.

QTUM Descending Triangle *** Stops need to be re-adjusted and R:R reassessed at point of entry. As a guide, I usually count 6-8 candles back from my entry point on the timeframe I’m trading on and place my stop just below the lowest wick within those 8 candles in the case of a short, or above the highest wick of the last 8 candles in the case of the long. If this rule means your R:R to target one is not good, don’t take the trade. ***
QTUM
Probable
- Long term descending triangle on daily - bearish pattern
- EMA’s bearish on daily, 12hr & 4hr
- Looking for BCR of yellow box zone
- 2 short targets
Possible
- Look to see if we create a HL within the triangle for a heads up trend may change
- Wait for EMA’s to turn up and cross bullish
- Wait for break out of the long term down trend line
- Wait for retest of the new support
- 2 long targets


QTUM USDT | 1D chart | Long Position | Possible 50% gainBINANCE:QTUMUSDT
Entry Price: 2.120
Take profit: 3.179
Possible gain: 50%
What do you think about this strategy, share your comments below;
Make sure to subscribe!
If you enjoyed this Idea hit the Like button and support us!


Falling Wedge + VAL-Falling wedge
-Daily pivot
-Daily 200ma
-Parallel channel
Targets: poc, vah, final target below daily pivot p.
Keep it Simple, Manage Your Risk, & Don't get REKT!!
//Disclaimer: This is not financial advice.


