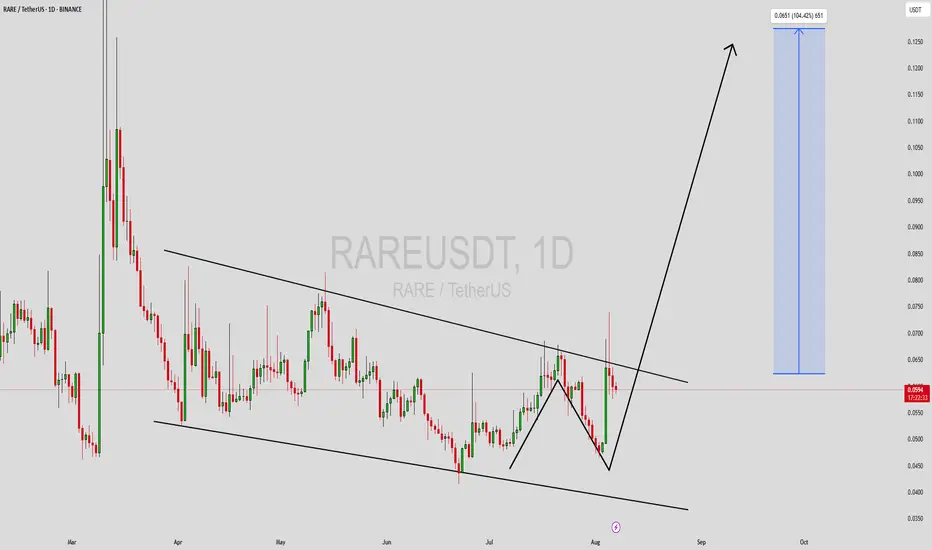
RAREUSDT Forming Bullish WaveRAREUSDT is currently forming a powerful bullish wave pattern on the daily chart, indicating a strong momentum buildup and potential for a massive breakout. This structure is often a hallmark of continued trend movement, especially when supported by increasing volume and investor interest. The price appears to be following a classic wave cycle, where each dip is met with stronger buying pressure—pointing toward a possible explosive move to the upside in the coming days or weeks.
The current setup is especially appealing to technical traders, with RAREUSDT maintaining its bullish structure above key support levels and preparing for a potential next wave that could deliver gains in the range of 140% to 150% or more. Volume analysis shows increasing activity, suggesting that smart money might already be positioning itself ahead of a bigger rally. The bullish wave pattern unfolding suggests continuation and trend strength, with higher highs and higher lows giving traders the confidence to target extended price levels.
As more investors take notice of the bullish technical pattern and volume surge, RARE becomes a coin to watch closely in the altcoin market. Its recent price action, combined with wider market optimism and social buzz, makes it a solid candidate for mid-term swing trades. With the proper risk management, this chart could be a textbook example of a breakout from accumulation into expansion.
If you're eyeing high-probability technical setups in the crypto space, RAREUSDT certainly deserves a place on your watchlist.
✅ Show your support by hitting the like button and
✅ Leaving a comment below! (What is You opinion about this Coin)
Your feedback and engagement keep me inspired to share more insightful market analysis with you!
RAREUSDT trade ideas
RARE FLY SOONSuperRare
SuperRare is a NFT art platform on Ethereum
Everything is clear on the chart.
It's time to fly.
I wish everyone abundant profits.
Like and follow
for more.

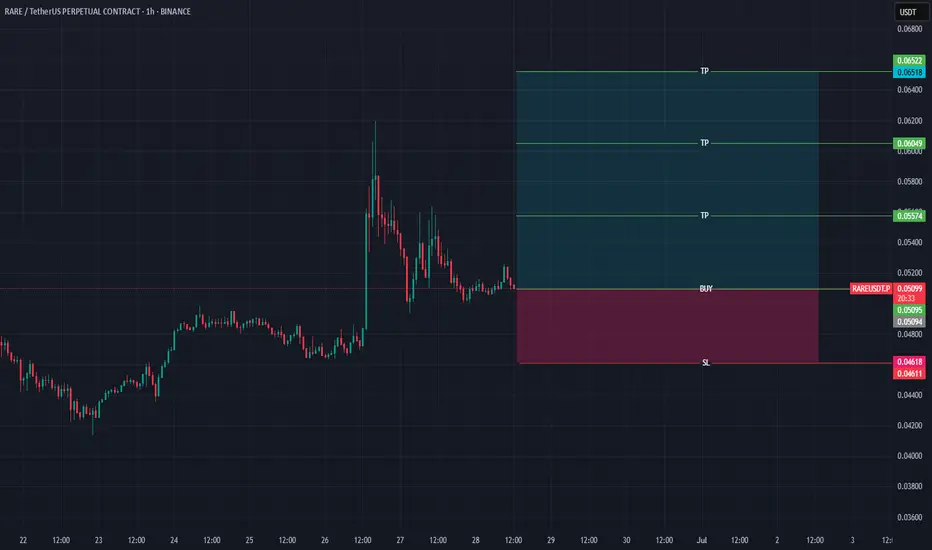
RARE/USDT – Long-Term SetupRARE is forming a long-term descending triangle and showing signs of accumulation near the bottom range. A breakout from this structure can initiate a trend reversal.
Chart Analysis:
Downtrend line tightening with horizontal support
Current price testing triangle resistance
RSI trending upward (50), early bullish signal
Key Levels:
Entry: $0.051–$0.053
Stop Loss: $0.042 (below long-term support)
Targets:
Target 1: $0.061
Target 2: $0.074
Target 3: $0.097
Target 4: $0.183 (macro target)
Support Zones: $0.042, $0.035
Breakout Confirmation: Daily close above $0.061 with volume
This is a high-risk, high-reward accumulation play for long-term investors. Wait for breakout and volume confirmation.
DYOR. Not financial advice.

$RAREUSDT Breakout Loading137% Rally in Sight?RARE just bounced strongly from a key support zone, gaining over 20% in a day.
It’s now testing a long-term descending trendline.
A breakout above this level could trigger a bullish reversal, with a potential target around $0.1414, a 137% upside.
DYRO, NFA

RAREUSDT | Strong Buyers, Clear Demand ZoneRAREUSDT is showing clear signs of strong buyer activity. The blue box below marks a clean demand zone that has held well in the past.
If price revisits that area, I’ll be watching for low-timeframe confirmation. No need to rush — the structure supports patience, and the buyers are doing their part.
These are the setups that most ignore, and later wish they hadn’t.
📌I keep my charts clean and simple because I believe clarity leads to better decisions.
📌My approach is built on years of experience and a solid track record. I don’t claim to know it all but I’m confident in my ability to spot high-probability setups.
📌If you would like to learn how to use the heatmap, cumulative volume delta and volume footprint techniques that I use below to determine very accurate demand regions, you can send me a private message. I help anyone who wants it completely free of charge.
🔑I have a long list of my proven technique below:
🎯 ZENUSDT.P: Patience & Profitability | %230 Reaction from the Sniper Entry
🐶 DOGEUSDT.P: Next Move
🎨 RENDERUSDT.P: Opportunity of the Month
💎 ETHUSDT.P: Where to Retrace
🟢 BNBUSDT.P: Potential Surge
📊 BTC Dominance: Reaction Zone
🌊 WAVESUSDT.P: Demand Zone Potential
🟣 UNIUSDT.P: Long-Term Trade
🔵 XRPUSDT.P: Entry Zones
🔗 LINKUSDT.P: Follow The River
📈 BTCUSDT.P: Two Key Demand Zones
🟩 POLUSDT: Bullish Momentum
🌟 PENDLEUSDT.P: Where Opportunity Meets Precision
🔥 BTCUSDT.P: Liquidation of Highly Leveraged Longs
🌊 SOLUSDT.P: SOL's Dip - Your Opportunity
🐸 1000PEPEUSDT.P: Prime Bounce Zone Unlocked
🚀 ETHUSDT.P: Set to Explode - Don't Miss This Game Changer
🤖 IQUSDT: Smart Plan
⚡️ PONDUSDT: A Trade Not Taken Is Better Than a Losing One
💼 STMXUSDT: 2 Buying Areas
🐢 TURBOUSDT: Buy Zones and Buyer Presence
🌍 ICPUSDT.P: Massive Upside Potential | Check the Trade Update For Seeing Results
🟠 IDEXUSDT: Spot Buy Area | %26 Profit if You Trade with MSB
📌 USUALUSDT: Buyers Are Active + %70 Profit in Total
🌟 FORTHUSDT: Sniper Entry +%26 Reaction
🐳 QKCUSDT: Sniper Entry +%57 Reaction
📊 BTC.D: Retest of Key Area Highly Likely
📊 XNOUSDT %80 Reaction with a Simple Blue Box!
📊 BELUSDT Amazing %120 Reaction!
📊 Simple Red Box, Extraordinary Results
I stopped adding to the list because it's kinda tiring to add 5-10 charts in every move but you can check my profile and see that it goes on..

RAREUSDT 5D AnalysisRARE ~ 5D Analysis
#RARE Buy gradually from here with a short -term target of at least 15%+. This is the lowest support for now.

RARE/USDT: LOW RISK, HIGH REWARD SETUP!!🚀 RARE Breakout Alert – 150%+ Potential Incoming?! 👀🔥
Hey Traders! If you're all about high-conviction plays and real alpha, smash that 👍 and tap Follow for more setups that actually deliver! 💹💯
RARE/USDT just broke out of a symmetrical triangle on the 4H chart and is now perfectly retesting the breakout trendline. If this level holds, we could be gearing up for a massive upside move in the coming days. 📈🔥
🔹 Entry: CMP
🔹 Targets: 130%–150%
🔹 SL: $0.0538
🔹 Leverage: Low (Max 5x recommended)
💡Strategy Tip: Go in with tight risk management. Consider adding on spot for a safer ride!
💬 What’s Your Take?
Jumping in early or waiting for confirmation? Let’s chart this journey together—drop your analysis, targets, or questions in the comments! 💰🧠

RAREUSDT READY tO lONG position with CGI IndicatorRAREUSDT READY tO lONG position with CGI Indicator

LIMIT ORDER - #RARE/USDTLIMIT ORDER - $RARE/USDT
Direction: #Long 🟢
Entry Price: 0.072120
Stop Loss: 0.053032
Target 1: 0.081452
Target 2: 0.090783
Target 3: 0.10011
Target 4: 0.10945
Target 5: 0.11878

RAREUSDT 5DRARE ~ 5D Analysis
#RARE Buy gradually from here if you still have a Conviction on this coin with a short -term target of at least 20%+.

#RARE/USDT#RARE
The price is moving within a descending channel on the 1-hour frame, adhering well to it, and is on its way to breaking it strongly upwards and retesting it.
We are seeing a bounce from the lower boundary of the descending channel, which is support at 0.0823.
We have a downtrend on the RSI indicator that is about to break and retest, supporting the upward trend.
We are looking for stability above the 100 Moving Average.
Entry price: 0.0863
First target: 0.0910
Second target: 0.0952
Third target: 0.1014

RARE Analysis (3D)From the point where we placed the red arrow on the chart, the RARE correction has begun.
It appears that we have a double correction on the chart, and now the second phase of this correction has started.
After the completion of wave X, a supply zone has formed, which seems to act as the price ceiling for RARE.
As long as the red box holds, we expect a downward correction.
A daily candle closing above the invalidation level will invalidate this analysis.
For risk management, please don't forget stop loss and capital management
Comment if you have any questions
Thank You

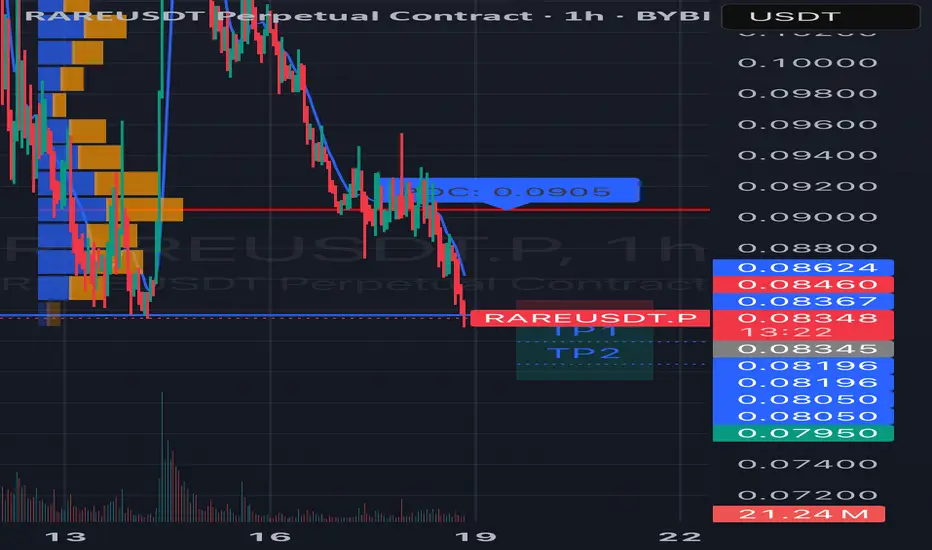
#RAREUSDT continues its downtrend📉 Short BYBIT:RAREUSDT.P from $0,08345
🛡 Stop loss $0,08460
🕒 1H Timeframe
⚡️ Overview:
➡️ The main POC (Point of Control) is 0,09094
🎯 TP Targets:
💎 TP 1: $0,08196
💎 TP 2: $0,08050
💎 TP 3: $0,07950
📢 Monitor key levels before entering the trade!
BYBIT:RAREUSDT.P continues its downtrend — watching for further movement!
#RAREUSDT - Rise Didn’t Get Confirmed, Is the Game Over ?Hey there, everyone! I’m here with the popular coin of the moment, #RAREUSDT.
I’ve already explained it on the chart, but let me briefly summarize. The 5th wave in the Elliott count failed during the uptrend, meaning the rise didn’t get confirmed. In the next attempt, it formed a double top pattern, signaling that the uptrend didn’t get confirmed and is now over. There’s a slight chance we might see a death cat bounce pattern around the 0.085 level, with a short bounce towards the 0.095-0.096 range.
But let’s not forget, “Don’t catch a falling knife!” everyone... Every rise should be seen as a selling opportunity, and that’s where I’ll end my analysis.
What do you think about my analysis? Drop your thoughts in the comments and let’s discuss!
Manage your risk, stay in the game! 🎯🔥
#AlyAnaliz #TradeSmart #CryptoVision #RAREUSDT

RAREUSDT(SuperRare) Updated till 14-03-25RAREUSDT(SuperRare) Daily timeframe range. PA had a strong pullback from its new low. alltho we got more sellers against volume. but if buyers can defend 0.0858 it got long way to go. range resistance at 0.1351.

RAREUSDT CHART ANALYSİS - EDUCATIONAL POSTThe NFT Concept
You may already know that each unit of value in a blockchain is called a token. In an open blockchain, all tokens are equal and interchangeable. For example, one bitcoin can be easily replaced with another, and nothing will change.
Non-fungible tokens are a game-changer, which work differently. An NFT is a digital asset that cannot be replaced with another token without changing the value and basis of the object.
Like cryptocurrency, NFTs are created on a blockchain, which acts as a database to record all transactions. The blockchain guarantees the uniqueness, safety, and anonymity of non-fungible tokens. Thanks to this system, any user can verify the originality and transparency of the history of a particular NFT through the blockchain.
When you buy an NFT token, you are obtaining a certificate for a digital or real object. However, the work itself doesn’t move anywhere. You only use its digitized file or a certificate of ownership. Once created or purchased, the token sits in perpetual storage. This certificate is just lines of code that confirm it is the token owner who has the original copy of the object.
An NFT token can be compared to a painting, which may belong to a gallery, museum, or individual, but the audience can see it in a catalog or exhibition.
NFT tokens are sold in online marketplaces that operate like Amazon. The creators put them on marketplaces and wait for bids from buyers.
An NFT token can be created by you or by anyone for that matter. To do this, you need to take a digital object (picture, music, photo, etc.), register in a particular marketplace on a platform such as Rarible or OpenSea, and upload the object with a description and price. You will have to pay a fee for creating a blockchain entry on many platforms. However, the costs pay off in most cases, as NFTs are #1 in the crypto world today.

RAREUSDT – Volume Exploding! Smart Entry at Blue Box? “A 173% volume spike is NOT random—something is brewing, and we’re watching closely!”
🔥 Key Insights:
✅ Massive Volume Surge – Increased activity means big players are positioning.
✅ Blue Box = Smart Entry Zone – This is where we want to see reactions.
✅ LTF Confirmations = Key – We don’t jump in blind; CDV & market structure must align.
💡 The Plan:
Wait for Price to Reach the Blue Box – Let the market come to us.
Look for LTF Breakouts & CDV Confirmation – Smart money leaves signals.
If No Confirmation? No Trade. We Stay Disciplined.
“Volume is the first clue, structure is the confirmation—stay sharp, don’t miss the move!”
📌 USUALUSDT: Buyers Are Active + %70 Profit in Total
🌟 FORTHUSDT: Sniper Entry +%26 Reaction
🐳 QKCUSDT: Sniper Entry +%57 Reaction
📊 BTC.D: Retest of Key Area Highly Likely
I stopped adding to the list because it's kinda tiring to add 5-10 charts in every move but you can check my profile and see that it goes on..

RARE BuySo how 7-star got that buy print? because Rare was listed on coinbase international futures. Buy the rumour and sell the news. That's how 7-star works.
For indicator access, you can drop a message.

RARE COIN PRICE PREDICTION AND ANALYSIS!!NASDAQ:RARE Coin Update!!
• If price drop b/w 0.082$-0.076$ area and manage to hold it then again pottential bounce back expected🫡
• Without SL Trade is Not recommended🚨
Warning : That's just my idea DYOR Before taking any action🚨

RARE/USDT- BUY SETUPBINANCE:RAREUSDT higher time frame buy setup
buy zone : 0.0875 - 0.0760
💡Reason for this trade:
This trade gives my trading system a sign of strength:
• My trading system is based on liquidity and reversal zones.
• When the liquidity is swept from one side under certain conditions, we will wait for the price on the other side.
The liquidity will attract the price like a magnet.
• the first side that has been swept:
1- range low
2- conflance with internal FVG
3- conflance with pump candle low
• Opposite side targets:
1- first swing high liqudity above volume profile POC
2- range high
3- first external swing high above range
💡Entry setup
1- reclaim BPR (balance price range)
⚠️WARNING:
• I'm not a financial advisor.
• Do your own research (DYOR).

RARE in Accumulation – Bulls Preparing for a Move?$RARE/USDT 1W chart shows that the price is trading within a sideways range, consolidating between the support and resistance zones. The price has bounced multiple times from support and has also faced rejection from resistance on several occasions, confirming the range-bound structure.
The Stoch RSI is in the oversold region, indicating that a potential bullish move could be forming.
DYOR, NFA

RAREUSDT Poised for Breakout from Falling Wedge – High Volume SuperRare (RARE) is currently forming a falling wedge pattern on the daily chart, a technical setup often indicative of a potential bullish reversal. This pattern is characterized by converging trendlines that slope downward, suggesting a decrease in selling pressure and the possibility of an impending breakout to the upside.
The trading volume for RARE has been robust, reinforcing the likelihood of a significant price movement upon breakout. Elevated volume during the formation of a falling wedge typically signifies growing investor interest and confidence in the asset's future appreciation.
Technical analysis further supports this optimistic outlook. Indicators such as the Moving Average Convergence Divergence (MACD) are showing bullish signals, while the Exponential Moving Averages (EMAs) and Relative Strength Index (RSI) are neutral, suggesting that RARE is poised for a potential upward surge
Given these factors, RARE is anticipated to achieve gains ranging from 180% to 200% or more upon a confirmed breakout. The combination of a well-defined falling wedge pattern, substantial trading volume, and supportive technical indicators suggests that RARE may experience a significant price increase in the near future.
✅ Show your support by hitting the like button and
✅ Leaving a comment below! (What is your opinion about this coin)
Your feedback and engagement keep me inspired to share more insightful market analysis with you!
