Where does RARE go?After its correction, it has been pumped up sharply.
Because it has not corrected on the way and has moved towards fresh supplies with a spike, it is expected to be rejected from the premium areas of the previous waves downwards (with a large time correction).
Closing a daily candle above the red supply box will violate this analysis
For risk management, please don't forget stop loss and capital management
When we reach the first target, save some profit and then change the stop to entry
Comment if you have any questions
Thank You
RAREUSDT trade ideas

RAREUSDTWe can attempt to buy RAREUSDT from specified level as it make HL , also there is no bearish divergence occur indicate that it moves upward.
SL , TP mention in chart.

RAREUSDThi friends...
RARE seems to get bulish... i open a position on it... i used Ichimuko & price action on this TA...
please give me your opinion about my TA
thanks

Rare Unlocking the Potential of Digital CollectiblesDescription
Crypto Rare (RARE) is positioned as a unique digital asset within the booming NFT (Non-Fungible Token) market, offering a compelling investment opportunity for those looking to enter the space of digital collectibles and blockchain art. Key fundamentals supporting a buy trade for RARE include:
- **Growing NFT Market:** The global NFT market continues to expand rapidly, with increasing mainstream adoption and institutional interest. RARE stands out as a key player within this sector, benefiting from this growth.
- **Strong Utility and Use Case:** RARE tokens are used within a decentralized marketplace for digital art and collectibles, providing artists and creators with an ecosystem to monetize their work. This utility drives the long-term value proposition of the token.
- **Community and Partnerships:** Crypto Rare has a growing community of supporters and collaborations with notable artists and platforms, enhancing its reputation and adoption in the digital space.
- **Scarcity of Supply:** The rarity and limited supply of Crypto Rare assets drive demand, making it a potentially valuable token in the long run, especially as the digital collectibles space continues to evolve.
With these strong fundamentals in place, RARE presents a strategic buy opportunity for investors looking to capitalize on the future of digital art and collectibles.
Disclaimer
Trading and investing in cryptocurrencies involve significant risks and can result in substantial losses. The content provided here is for informational purposes only and should not be considered as financial advice. Always perform your own research, assess your risk tolerance, and consult a financial advisor before making any investment decisions. Cryptocurrency markets can be highly volatile, and past performance is not indicative of future results.

RAREUSDT_The profit is Big shot!!!In 4hrs time frame, the chart is shown Flag pattern and breakout from the pattern at 0.25 USDT. I was waiting open position at 0.1772 USDT and TP at 0.1236 USDT. This position is traded in RAREUSDT.P (Future marker) with leverage 75X. Profit target is around 2,390%.
What do you think about this?
BR,
Cryptothanya Trader :)

RAREUSDT SHORT Let´s short it to the ground and you will make a bag of money.
Good luck.
Short : 0.2250
Tp: 0:1350

RARE/USDT: POTENTIAL FALLING WEDGE PATTERN!!Hey everyone!
If you're enjoying this analysis, a thumbs up and follow would be greatly appreciated!
RARE looks good here. Forming a falling wedge-like structure in 4hr time frame and currently hovering near the lower trendline of the wedge. Expecting a good bounce from here. Buy some here and add more in the dip.
Entry range:- $0.136-$0.143
Targets:- $0.168/$0.184/$0.202/$0.24
SL:- $0.129
Lev:- 2x-4x
What are your thoughts on RARE's current price action? Do you see a bullish pattern? Share your analysis in the comments below!

Phemex Analysis 18: RARE's Next Move - Bullish or Bearish?PHEMEX:RAREUSDT.P recently experienced a meteoric rise, surging 300% in just three days. However, market sentiment quickly turned bearish, leading to a 54% price decline from its all-time high (ATH).
Given this volatility, many traders are wondering what to expect next. Will RARE's price continue to drop, or could a reversal be imminent? Is now a good time to buy low, or should we consider shorting?
To answer these questions, let's explore key support and resistance levels for RARE, and a few potential scenarios:
Support and Resistance Levels
Strong Support: $0.095, the level that marked the beginning of the recent parabolic rally. A break below this level could signal a more significant downtrend.
Intermediate Support: $0.135. A retest of this level could provide a buying opportunity, but a break below it would weaken the bullish case.
Resistance Levels: $0.172 and $0.19. These levels represent potential barriers to a sustained uptrend. A break above these levels would be bullish.
Potential Scenarios
Continued Decline: If RARE's price continues to fall, support levels at $0.135 and $0.095 may be crucial. The $0.095 level is particularly significant as it marked the beginning of the 300% rally. While buying the dip at these support levels might offer opportunities, it's essential to manage risk by avoiding over-allocation.
Quick Rebound: Although less likely, a rapid price increase cannot be ruled out. If RARE's price surges, resistance levels at $0.172 and $0.19 could act as barriers. Short-term traders might consider going long during such a rally, aiming to profit from the subsequent pullback.
Consolidation: Before another significant rally, RARE may need a period of consolidation to accumulate buying power. This could occur after a pullback to resistance levels or a decline to support levels. Patience is key in this scenario; wait for price action to confirm either scenario 1 or 2 before gradually accumulating positions.
By carefully considering these factors and potential scenarios, you can make more informed decisions about your RARE investment.
Note: Elevate Your Trading Game with Phemex. Experience unparalleled flexibility with features like Multiple Watchlists, Basket orders, and Real-time Adjustments to Strategy orders. Our USDT-based Scaled ordersgive you precise control over your risk, while Iceberg orders provide stealthy execution. Join Phemex today and unlock your trading potential.
Disclaimer: This is NOT financial or investment advice. Please conduct your own research (DYOR). Phemex is not responsible, directly or indirectly, for any damage or loss incurred or claimed to be caused by or in association with the use of or reliance on any content, goods, or services mentioned in this article.

Elliot and Fractal BullishHi,
as you can see I think we are waiting 5th wave so first target is important it should stay above it after breakout the last Top,,
Also I'm waiting to see up-trend as the fractal told me :)

RARE | Scalping TradeScalping trade opportunity can be established in this coin
Entry: 0.1676
Target: 0.2020
Stop Loss: 0.1504
R/R Ratio = 1:2
Return: 20.53%

$0.16 is Imminent for $Rare (SuperRare)$0.16 is Imminent for NASDAQ:RARE (SuperRare)
NASDAQ:RARE is currently struggling with FIB61.8 as a support zone. If this asset breaks this support level, we may see SuperRare fall to $0.1600 and possibly $0.14 if the bears push harder. Watch out for the zones.

RARE Local view.BYBIT:RAREUSDT.P
This idea has a long-term profit target.
All targets are indicated on the graph.
- Risk 1-3% on deposit
- R/R min 1/2
P.S (This is not an investment recommendation, this is my personal opinion.)

RAREUSDT.P 1H ICT MODEL TS PLAY (THU 22/08/24)not quite optimistic for the price to go down there any moment soon, but let's see if it's gonna be good or not
RAREUSDT.PRAREUSDT.P is in ranging mode.
Bearish divergence also form .
We wait for the lower breakout of reanging mode.
If trend will break the lower side.
Then it will definately go to bearish trend.
we wait for the lower breakout.

Rare Bullish ideaRare making bull pennant here and also have golden cross on daily time frame one more confirmation is that, it has also done breakout of 99ema

RARE#rare is framing ascending triangle in the 1h time frame , Now it break out down side .
I would like to short , but with tight sl🚨
Sl is $0.2485.
#NFA
#DYOR


RAREReally small margin used for this, but high leverage.
Accumulation range forming here, so we play the bottom to the top until it breaks.

RAREBitcoin's back baby.
Bears in utter disbelief.
9$ billion worth of shorts above us awaiting liquidation.
You bet your last penny that the market makers are gunning for those liquidation prices.

RARE#RARE
Now:17h41 23.8.2024 GMT+7, Hanoi, Vietnam
Chart:H4
Contact me by clicking on the link pinned on my profile
Note: I never texted you first.
#giapduclong #crypto #forex #index #stock #trader #signal

RARE RARE printed massive weekly candle and broke- out important S/R level
if it will will able to hold above it … a new bullish wave would be expected
Invalidation = loss S/R level
Best of wishes

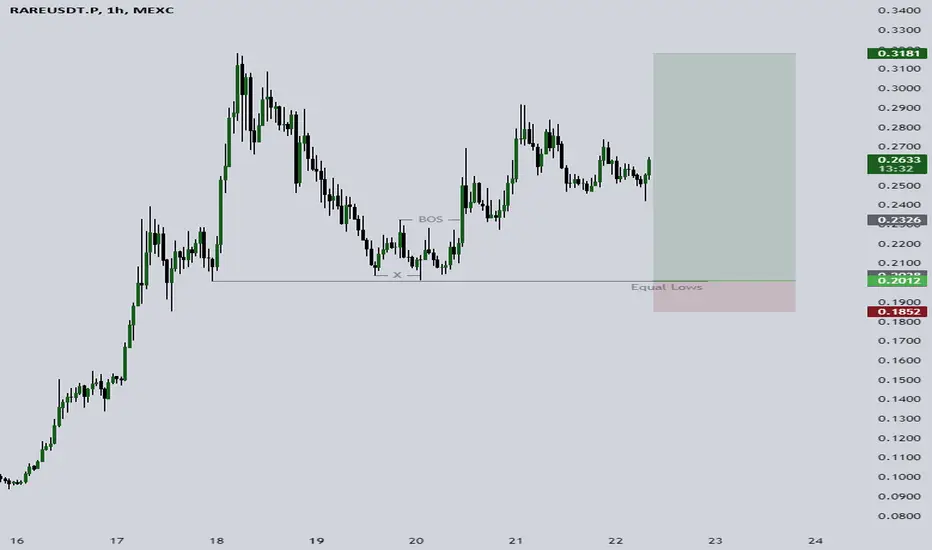
#RARE/USDT breaks the Diagonal Trendline in 15-Minut TF!#RARE/USDT breaks the Diagonal Trendline in 15-Minut TF!
There is a 5M FVG there, where we can long $RARE. The local support level is PDL $0.2038 and the resistance level is PWH $0.3181. The funding is still negative.

RARE is forming 30M Bull FlagIn the chart, there’s a noticeable strong upward movement before the price starts to consolidate and move downwards in what seems to be a parallel downward channel. This fits the definition of a bull flag.
Key Features:
1. Flagpole: The strong upward price movement prior to the channel is the flagpole. This move is typically steep and occurs over a relatively short period, which is visible in your chart.
2. Flag: The downward sloping channel after the initial upward surge. This represents a period of consolidation before a potential continuation of the previous trend. The chart shows this phase quite clearly, with the price making lower highs and lower lows within the channel.
Price Action:
- The price is currently near the lower boundary of the channel, suggesting a possible breakout to the upside if the bull flag pattern completes successfully.
- The presence of buy and sell signals (as shown by the B and S labels on the chart) within the channel further indicates trading activity within this consolidation phase, with sellers dominating the upper part of the channel and buyers stepping in near the lower part.
Next Steps:
- Breakout Confirmation: A breakout above the upper trendline of the flag (typically on increased volume) would confirm the bull flag and suggest a continuation of the prior uptrend.
- Risk Management: However, if the price breaks below the lower boundary of the flag, it could invalidate the bull flag and potentially signal a reversal or further downside movement.
Conclusion:
The chart is showing a classic bull flag pattern, which is generally a bullish continuation pattern. Monitoring for a breakout above the flag will be crucial to confirm this bullish bias. If a breakout does occur, it could lead to a continuation of the upward trend seen in the flagpole phase.
