RAYSOL/USDTKey Level Zone: 2.1600 - 2.1780
HMT v8.1 detected. The setup looks promising, supported by a previous upward/downward trend with increasing volume and momentum, presenting an excellent reward-to-risk opportunity.
HMT (High Momentum Trending):
HMT is based on trend, momentum, volume, and market str

RAYSOL/USDT – READY TO BLAST OFF? PRIME LONG SETUPThis is where smart money is likely to reaccumulate before pushing price higher.
We're targeting internal liquidity levels and prior highs with a clean risk-reward structure.
Confirmation can come from a bullish reaction or engulfing candle within the zone.
Entry Zone: 2.25 – 2.28
Targets:
TP1: 2

shortBearish diverguence H4 is in an important reciaticism and is being generated a distribution zone therefore minimum risk short
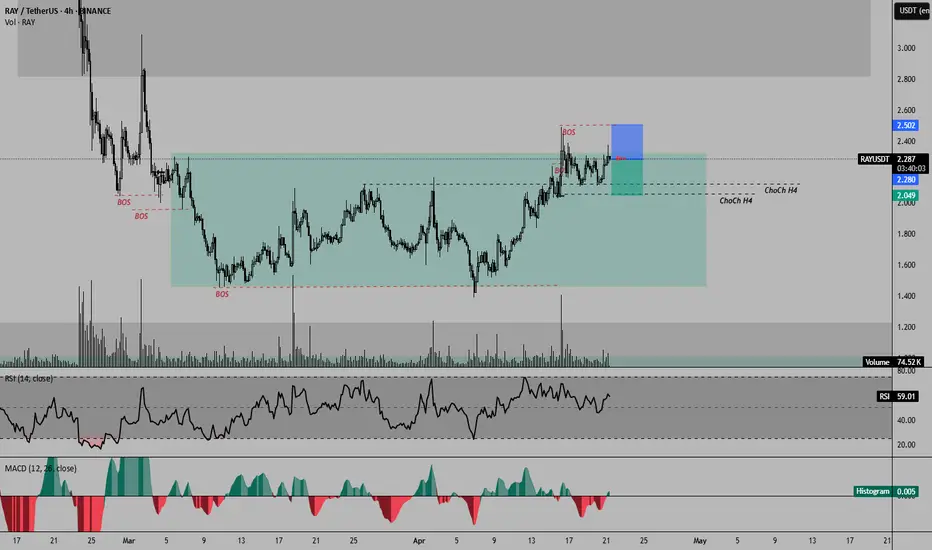
#RAY Double Top Bearish Structure📊#RAY Double Top Bearish Structure 📉
🧠From a structural perspective, the goals of the bullish structure have all been achieved, and the target area overlaps with the blue resistance area, and we have built a bearish double top structure in the overlapping resistance area, so we are likely to enter

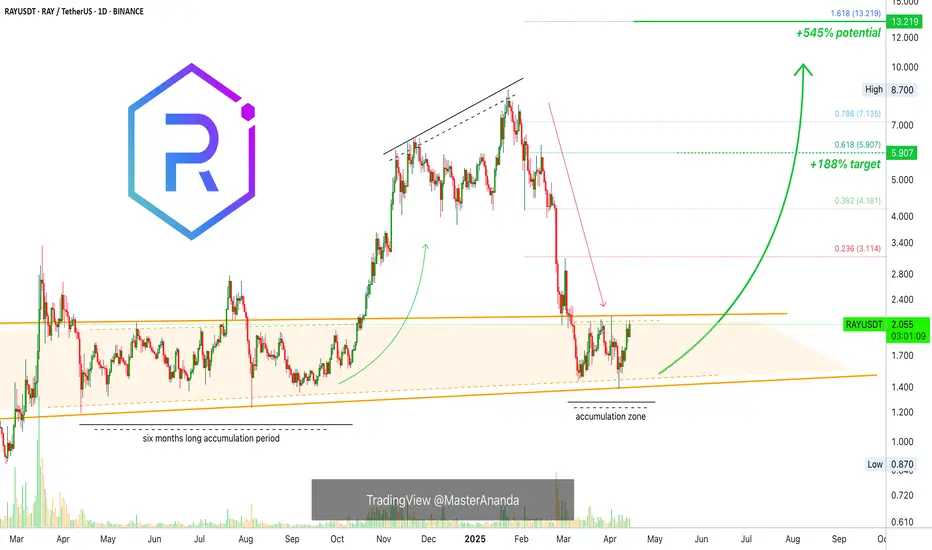
Raydium Medium Sized +545% Wave Mapped (Trading Strategy)This is one of those pairs that grew in astonishing ways since late 2023. Raydium managed to grow by 5,372% from October 2023 through January 2025. Simply amazing. I was very surprised when I found this pair as it moved beyond all expectations.
The last advance was preceded by a six months long con
Breaking: Raydium ($RAY) Reclaims $2 PivotRaydium's ( NASDAQ:RAY ) which is an automated market maker (AMM) and liquidity provider built on the Solana blockchain for the Serum decentralized exchange (DEX)'s native token has reclaimed the $2 pivot albeit the crypto market is in a general market correction.
The asset surge 6%, and is gearin

Raydium support zonesRay is currently moving up longer-term. A trade could be caught on the zones shown

long $RAY Radium broke through the resistance level and the descending trendline. The bullish movement to $3.09 is expected to happen

RAYUSDTRaydium consolidation.
in high time frame this aset not interested, but who knows, if liquidity in aset Raydium mybe will jump

RAYUSDT LONG above $2Look for RAYUSDT to break above $2.
Can see price move upwards to previous swing high around $7.
Long term Target above $28.
Bullish all crypto. Remember if these projects don't run out of money and blow up.
They will go up in price. Long RAYUSDT

See all ideas
Summarizing what the indicators are suggesting.
Oscillators
Neutral
SellBuy
Strong sellStrong buy
Strong sellSellNeutralBuyStrong buy
Oscillators
Neutral
SellBuy
Strong sellStrong buy
Strong sellSellNeutralBuyStrong buy
Summary
Neutral
SellBuy
Strong sellStrong buy
Strong sellSellNeutralBuyStrong buy
Summary
Neutral
SellBuy
Strong sellStrong buy
Strong sellSellNeutralBuyStrong buy
Summary
Neutral
SellBuy
Strong sellStrong buy
Strong sellSellNeutralBuyStrong buy
Moving Averages
Neutral
SellBuy
Strong sellStrong buy
Strong sellSellNeutralBuyStrong buy
Moving Averages
Neutral
SellBuy
Strong sellStrong buy
Strong sellSellNeutralBuyStrong buy
Displays a symbol's price movements over previous years to identify recurring trends.