RAYSOL/USDTKey Level Zone: 2.1600 - 2.1780
HMT v8.1 detected. The setup looks promising, supported by a previous upward/downward trend with increasing volume and momentum, presenting an excellent reward-to-risk opportunity.
HMT (High Momentum Trending):
HMT is based on trend, momentum, volume, and market structure across multiple timeframes. It highlights setups with strong potential for upward movement and higher rewards.
Whenever I spot a signal for my own trading, I’ll share it. Please note that conducting a comprehensive analysis on a single timeframe chart can be quite challenging and sometimes confusing. I appreciate your understanding of the effort involved.
Important Note :
Role of Key Levels:
- These zones are critical for analyzing price trends. If the key level zone holds, the price may continue trending in the expected direction. However, momentum may increase or decrease based on subsequent patterns.
- Breakouts: If the key level zone breaks, it signals a stop-out. For reversal traders, this presents an opportunity to consider switching direction, as the price often retests these zones, which may act as strong support-turned-resistance (or vice versa).
My Trading Rules
Risk Management
- Maximum risk per trade: 2.5%.
- Leverage: 5x.
Exit Strategy
Profit-Taking:
- Sell at least 70% on the 3rd wave up (LTF Wave 5).
- Typically, sell 50% during a high-volume spike.
- Adjust stop-loss to breakeven once the trade achieves a 1.5:1 reward-to-risk ratio.
- If the market shows signs of losing momentum or divergence, ill will exit at breakeven.
The market is highly dynamic and constantly changing. HMT signals and target profit (TP) levels are based on the current price and movement, but market conditions can shift instantly, so it is crucial to remain adaptable and follow the market's movement.
If you find this signal/analysis meaningful, kindly like and share it.
Thank you for your support~
Sharing this with love!
HMT v2.0:
- Major update to the Momentum indicator
- Reduced false signals from inaccurate momentum detection
- New screener with improved accuracy and fewer signals
HMT v3.0:
- Added liquidity factor to enhance trend continuation
- Improved potential for momentum-based plays
- Increased winning probability by reducing entries during peaks
HMT v3.1:
- Enhanced entry confirmation for improved reward-to-risk ratios
HMT v4.0:
- Incorporated buying and selling pressure in lower timeframes to enhance the probability of trending moves while optimizing entry timing and scaling
HMT v4.1:
- Enhanced take-profit (TP) target by incorporating market structure analysis
HMT v5 :
Date: 23/01/2025
- Refined wave analysis for trending conditions
- Incorporated lower timeframe (LTF) momentum to strengthen trend reliability
- Re-aligned and re-balanced entry conditions for improved accuracy
HMT v6 :
Date : 15/02/2025
- Integrated strong accumulation activity into in-depth wave analysis
HMT v7 :
Date : 20/03/2025
- Refined wave analysis along with accumulation and market sentiment
HMT v8 :
Date : 16/04/2025
- Fully restructured strategy logic
HMT v8.1 :
Date : 18/04/2025
- Refined Take Profit (TP) logic to be more conservative for improved win consistency
RAYUSDT.P trade ideas

shortBearish diverguence H4 is in an important reciaticism and is being generated a distribution zone therefore minimum risk short
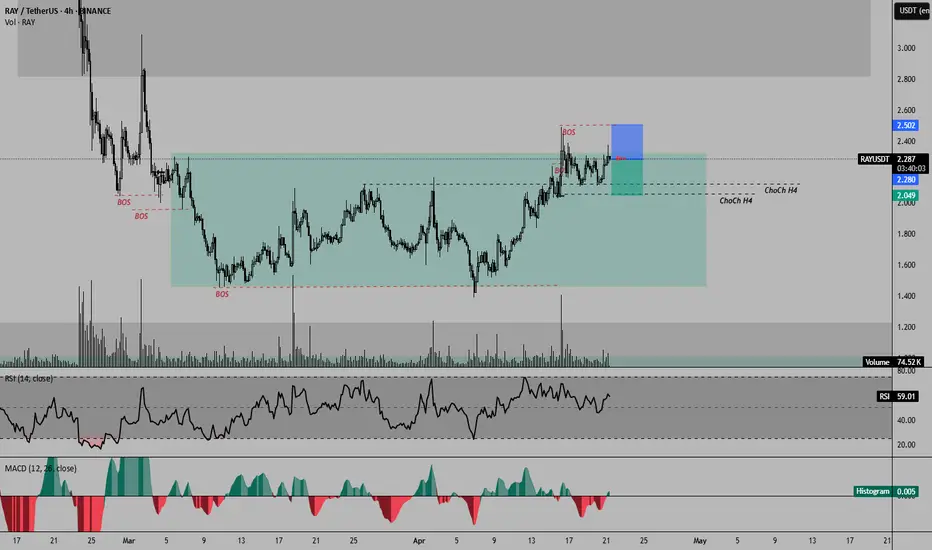
#RAY Double Top Bearish Structure📊#RAY Double Top Bearish Structure 📉
🧠From a structural perspective, the goals of the bullish structure have all been achieved, and the target area overlaps with the blue resistance area, and we have built a bearish double top structure in the overlapping resistance area, so we are likely to enter the adjustment phase, be cautious about bullishness!
Let's see 👀
🤜If you like my analysis, please like 💖 and share 💬
BITGET:RAYUSDT.P

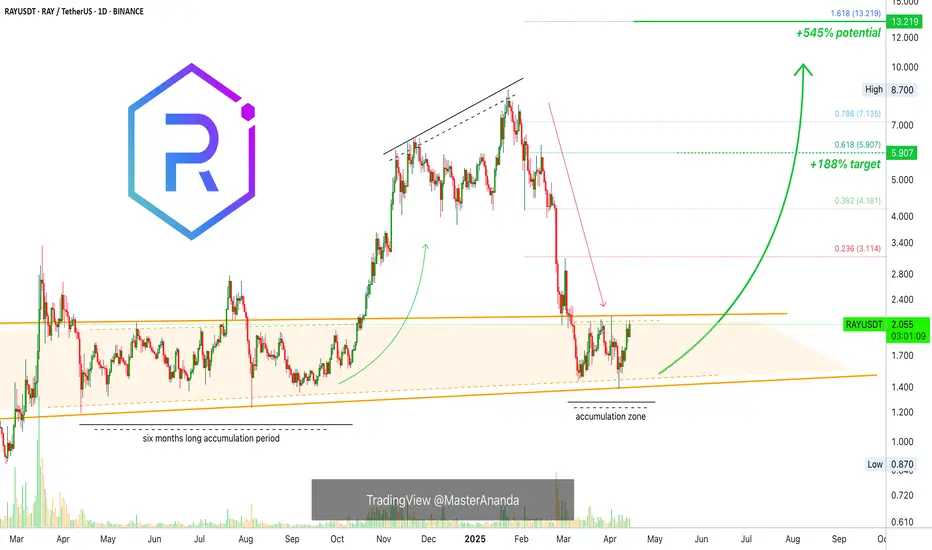
Raydium Medium Sized +545% Wave Mapped (Trading Strategy)This is one of those pairs that grew in astonishing ways since late 2023. Raydium managed to grow by 5,372% from October 2023 through January 2025. Simply amazing. I was very surprised when I found this pair as it moved beyond all expectations.
The last advance was preceded by a six months long consolidation phase. The whales used this period to accumulate. When one phase is long, the next one is short. This means that RAYUSDT can start to grow soon. This is based on the law of alternation.
Needless to say, the chart is full of higher lows and the action continues to be strong. I am tempted to open some LONGs.
This is a solid trade setup. It has low risk vs a high potential for reward.
This one can turnout into something good but please keep in mind that we have a little over two weeks before the market becomes full time bullish. Right now it is still early for the upcoming bullish wave. The reason I am all in now is because my group likes to enter early. Some other people prefer waiting and confirmation. We like early because it allows for maximum profits potential. The risk is higher but also the reward.
If you are uncertain or have doubts, you can always wait. The thing about Crypto is that when it moves it does so strongly, by the time we have confirmation the market is always several levels up. It can make a huge difference.
How you approach the market depends on your trading style, your risk tolerance, your capital, your goals. If you want to get in and get out, it is wise to wait until the action is hot. If you want relaxation, peace of mind and easy profits, it is better to buy and hold. If you have lots of time and energy to invest in this game, you can use all the different methods at the same time; a stack for long-term, a stack for passive hold, a stack for short-term and another portion of your capital for leveraged trades. It is also smart to leave some funds behind because good opportunities come out of nowhere. If we have funds available just because, we might end up with something that does better than our best choice.
It is a big game. It can be entertaining and profitable. There is lots to learn as well. You cannot hide here, if your ego is too strong, you will see the results in your funds. If you cheat yourself, if you lie to yourself, you will know it because your money will be gone. If you are honest with yourself and accept your mistakes, the market will give you as much as you can take.
Namaste.
RAYSOL/USDT – READY TO BLAST OFF? PRIME LONG SETUPThis is where smart money is likely to reaccumulate before pushing price higher.
We're targeting internal liquidity levels and prior highs with a clean risk-reward structure.
Confirmation can come from a bullish reaction or engulfing candle within the zone.
Entry Zone: 2.25 – 2.28
Targets:
TP1: 2.365
TP2: 2.485
TP3: 2.660
Stop Loss: 2.151
DYOR:
This idea is for educational purposes and reflects a personal trading plan.
Always do your own research, use strict risk management, and wait for confirmation before executing.
#RAYDIUM #RAY #RAYSOL #RAYUSDT

Raydium support zonesRay is currently moving up longer-term. A trade could be caught on the zones shown

Breaking: Raydium ($RAY) Reclaims $2 PivotRaydium's ( NASDAQ:RAY ) which is an automated market maker (AMM) and liquidity provider built on the Solana blockchain for the Serum decentralized exchange (DEX)'s native token has reclaimed the $2 pivot albeit the crypto market is in a general market correction.
The asset surge 6%, and is gearing up for a breakout to the $3 resistant as a breakout above the $2.3 region would cement the grounds for a bullish continuation move to the $3 point.
Unlike any other AMMs, Raydium provides on-chain liquidity to a central limit orderbook meaning that funds deposited into Raydium are converted into limit orders which sit on Serum’s orderbooks.
With the RSI at 60, Raydium is poised for the breakout move as momentum builds up.
However, should NASDAQ:RAY fail to pull up the stunt, a consolidation move to the $1.8 support point will be vehemently tested.
Raydium Price Live Data
The live Raydium price today is $1.99 USD with a 24-hour trading volume of $98,068,751 USD. Raydium is up 1.71% in the last 24 hours, with a live market cap of $578,910,409 USD. It has a circulating supply of 290,814,662 RAY coins and a max. supply of 555,000,000 RAY coins.

long $RAY Radium broke through the resistance level and the descending trendline. The bullish movement to $3.09 is expected to happen

RAYUSDTRaydium consolidation.
in high time frame this aset not interested, but who knows, if liquidity in aset Raydium mybe will jump

RAYUSDT LONG above $2Look for RAYUSDT to break above $2.
Can see price move upwards to previous swing high around $7.
Long term Target above $28.
Bullish all crypto. Remember if these projects don't run out of money and blow up.
They will go up in price. Long RAYUSDT

RAYMAN bullish divOn the 4 hr you can see a bullish div. Hoping for a head and shoulder pattern. Use stoploss! Could have one more wave down if we are in a wave 4. If not the yeah it looks good

RAYUSDT 1WRAY ~ 1W Analysis
#RAY Buy gradually from here if you still have a Conviction on this coin with a short -term target of at least 20%+.

Raydium RAY price analysisNot so long ago, we published an idea on #OM and wrote that MM holds the price well
And here's what happens when MM lets the price go "free floating" and stops pushing it up on the example of #RAY
If OKX:RAYUSDT fails to consolidate above $4 in the near future, there may be another wave down, and the price of #Raydium may drop to around $1.5
_____________________
Did you like our analysis? Leave a comment, like, and follow to get more

Breaking: Raydium ($RAY) Surge 15% TodayRaydium an automated market maker (AMM) and liquidity provider built on the Solana blockchain for the Serum decentralized exchange (DEX) saw its native token NASDAQ:RAY surge 15% today amidst general market volatility.
The asset while trading at the $6- $8 axis just a month ago lost almost 80% of total value plummeting from a high of $8 to almost $1.5 causing panic selling behaviour. But momentum is brewing up.
A move above the 61.8% Fibonacci retracement point could catalyse a bullish move for NASDAQ:RAY with a move to the 1-month high resistant. Similarly, with the RSI at 60, NASDAQ:RAY might experience a temporary cool-off a move that might lead to a consolidatory move to the 1-month low that is not too far from the current market price.
Raydium Price Live Data
The live Raydium price today is $1.86 USD with a 24-hour trading volume of $260,230,671 USD. Raydium is up 15.98% in the last 24 hours, with a live market cap of $541,218,025 USD. It has a circulating supply of 290,847,971 RAY coins and a max. supply of 555,000,000 RAY coins.

RAYSOLMaybe it is totally oversold and now it will explode by the news that Mr Trump give about Solana
SPOT trade

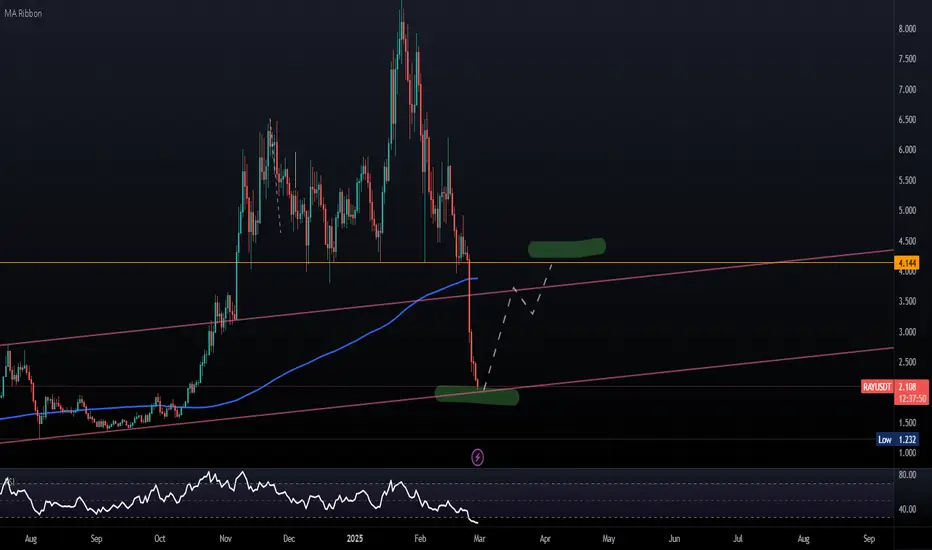
RAY - Long Scenario - $4RAY has pulled back to its long-term ascending support line. The expectation is for a retest of the previously lost support at $4.
Best, Hard Forky
$RAY Weekly AnalysisNASDAQ:RAY has retraced to a key support zone and ascending trendline.
A bounce here could confirm a bullish continuation with a target of $21.
Support: $2 $3
Resistance: $21 ATH
Bias: Bullish above support
Watching for a strong reaction. Breakout or breakdown?

Key Support Test – Will RAY Hold & Rally?$RAY/USDT chart shows a key retest of the breakout zone, which previously acted as resistance and is now a crucial support level. A successful bounce could confirm bullish continuation, while a breakdown may lead to further downside.
Additionally, the Stochastic RSI is signaling a bullish crossover at oversold levels, indicating potential upward momentum. If buyers hold this zone, RAY could see a strong rally.
DYOR, NFA

Is RAYUSDT About to Break Out? Key Levels to Watch Now!Yello, Paradisers! Is RAYUSDT gearing up for a massive breakout? The chart is showing a proper triple zigzag within a descending channel, which significantly increases the probability of an upcoming bullish move.
💎If RAYUSDT bounces from the current level, it could form a W-pattern, but for a high-probability setup, we need to see a breakout and a confirmed candle close above the key resistance. This move would also break the descending channel, signaling a stronger bullish push.
💎On the other hand, if the price retraces further or consolidates, a bounce may still occur, but the setup would be lower probability, making it less favorable to trade in this zone.
💎However, if RAYUSDT breaks down and closes below the support zone, the entire bullish setup will be invalidated. In that case, it would be wiser to wait for better price action before looking for new opportunities.
🎖 Patience and discipline are key, Paradisers. If this breakout happens, it will be a strong opportunity—but if invalidated, we wait for the market to present a better setup. Trade smart!
MyCryptoParadise
iFeel the success🌴

Raydium Price PlummetingThe price has experienced a significant drop, falling more than 25% below the average level. Historically, in 80% of cases, the price tends to revert to the average. Following the ShiftMA strategy, I plan to sell at the average price level. The strategy uses SMA (OHLC4, 3) for calculations.

#RAY/USDT#RAY
The price is moving in a descending channel on the 1-hour frame and is expected to continue upwards
We have a trend to stabilize above the moving average 100 again
We have a descending trend on the RSI indicator that supports the rise by breaking it upwards
We have a support area at the lower limit of the channel at a price of 4.10
Entry price 4.46
First target 4.60
Second target 4.75
Third target 4.92

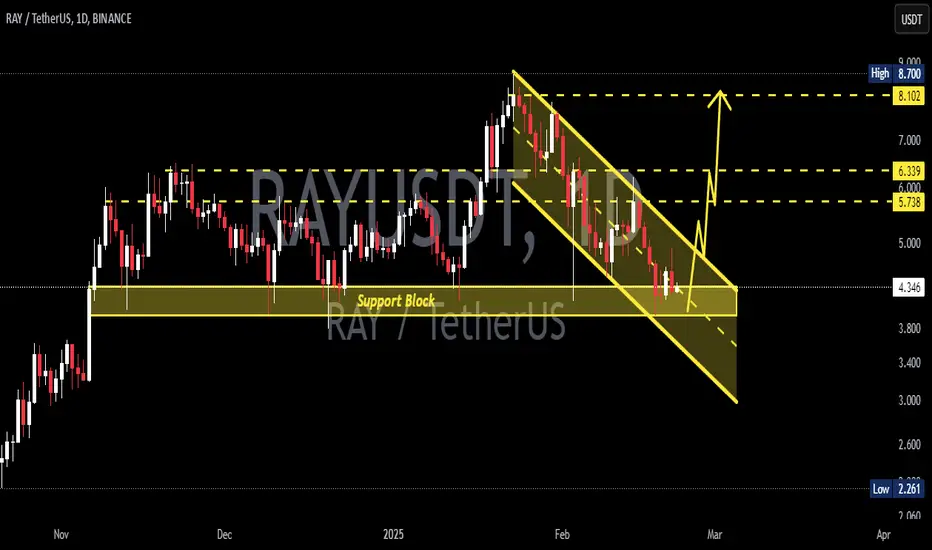
RAYUSDT 1DRAY ~ 1D Analysis
#RAY Buy from here or buy after successfully penetrating the resistant line of this pattern, with a minimum target of 15%+
RAYUSDT CHART ANALYSİS - EDUCATİONAL POSTHow NFT Technology Developed
NFT technology was created in 2017 based on Ethereum smart contracts. Since then, we have witnessed many successful NFT projects and deals. Stories like these perfectly describe the current and future possibilities of the technology.
The development of blockchain technology and the emergence of NFT services coincided with other processes in society and the economy. Many new players appeared in the stock markets, including non-professional traders and amateur investors.
The democratization of financial markets coincided with the pandemic: being in self-isolation, alone with their devices, many people began to pay attention to new financial instruments.
The information that arose around them also played a specific role in the “revival” of NFTs. The big names in the news headlines supporting NFTs couldn’t help but draw attention to them. That is one of the reasons why the success of the technology was inevitable.
