Ray target $3Reverse Head and Sholders. Looks like the target will be met quickly.
- 200MA is at 2.6$ - bottom
- Ascending channel support at 3.4 - possible bottom
BHF
RAYUSDT.P trade ideas

Timing the Second Best Entry on $RAY - RAYDIUMNASDAQ:RAY has hit a nice level of resistance, so now I'm looking to anticipate a small retrace into the low EUROTLX:4S for a potential add/entry.
I still see NASDAQ:RAY moving much higher as $SOLANA isn’t done yet. The MEME frenzy will keep going, and this cycle is gearing up for a strong final leg, with potential for BTC to enter a multi-year cycle.

RAY / USDT - Looking for a trend up to $5Raydium swap will grow as Solana grows. I see ray outperforming Solana in the mid to longer term (Weekly). Volume will only increase.
In the shorter term (Daily) I'm expecting a continued trend up towards $5 and above. I have left the chart as simple as i could. This is one of my high conviction plays.
This is not FA. Only a idea. I'm using smaller time frames to enter. Invalidation would be a brake of trend.
If you have liked this chart please boost and leave a follow to be among my first 100 followers here on trading view.

RAY / USDT I see ray in the near future making a move up to around $5.
If you would like any TA requested DM me the ticker and il post it here :)

martingale long strategyThis shows the rsi levels touching back and forth. Making it a perfect scenerio for martingale strategy


$RAYDIUM Local Bottom in?$RAYDIUM has been cooling off the pass week while the other assets gain. Ray hit the trend perfectly with a double bottom in the liquidity zone on the 4hr time frame. We could see continuation from here. Short term I can see an 18% gain from here with a longer view of %40 + in the coming weeks/month.
Entry: $5.4
TP 1: $6.35
TP 2: $6.9
TP 3: $7.8
If we break the $6.5 area, consider adding to your position or enter a new one on confirmation.
This is a longer swing trade that may take several weeks to play out, broader market dependant.
NFA and always do your own research. Nothing is guaranteed.
GL:)

Alikze »» RAY | Failure of the supply areaIn the weekly time, after a complex correction in the limit of 0.13, after the bottoming, it left the density and broke the first supply zone with a kinetic wave, and completed the supply zone with a three-wave pullback correction, and now it can Continue another kinetic wave to the specified areas.
⚠️If the green box area is lost, the transaction can be reversed. Therefore, be sure to pay attention to this point.
»»»«««»»»«««»»»«««
Please support this idea with a LIKE and COMMENT if you find it useful and Click "Follow" on our profile if you'd like these trade ideas delivered straight to your email in the future.
Thanks for your continued support.
Sincerely.❤️
»»»«««»»»«««»»»«««

Long opportunity in RAYDIUM/USDTIf breaks the level 5.4417 with a 15 Min green candle, there is an opportunity to go for a long trade.
Disclaimer : I'm not recommending to take this entry. Do with your analysis too.
Reasons : -
. Trend line breakout.
. Resistance level breakout.
. Buyers volume increasing
After Breakout :-
Entry : 5.4417
TP : 5.7854
SL : 5.2231


RAYUSDT symmetrical wedge on weeklyTitle says it all. Tight symmetrical wedge forming on $RAYUSDT. Looks great on the volume profile. Weekly EMA and VWAPS are supporting. I'm in but lightly for the moment.

RAYUSDT trading opportunityRAYUSDT broke free from downtrend pressure in February 2023, shifting to an uptrend after surpassing its downtrend line. These changes established accumulation zones that have guided subsequent price movements. The analysis highlights a bullish pennant formation, indicating strong price potential. The immediate demand zone serves as key support and a strategic buy-back level if the price retraces. Both short- and long-term pennant targets are outlined. Share your thoughts on this project.

Next Stop - Double the priceLooking at another daily/weekly breakout setup currently underway. Raydium on Solana constantly receives funds from profits made off of meme coin trading.
Meaning, it's virtually guaranteed the more money will be flowing through this coin. Trading volume will be exploding, and so will be the price!
We've already got a decent 30% pullback after the last run. Now I wouldnt be surprised if we saw another pullback, however, the bulls are strong right now so Im leaning towards a breakout sooner than a pullback. Looking at 10$+ on this next run. 100% breakouts are are normal across the crypto ecosystem now. Heck, even bitcoin's breakouts are 100%+.

RAY / USDT AnalysisNASDAQ:RAY / USDT Analysis
Entry Zone: $1.378–$2.355 (correction area).
Stop Loss: Below $1.378.
Targets:
T1: $9.848
T2: $13.153
T3: $17.491

RAY Opportunity: The Time to Jump In Is Now!D1scord and R3dd1t channels are projecting an impressive 200% probability of gains for RAY in the upcoming moves! Expectations are high that this asset is about to explode, and those positioned now stand to maximize the potential of this pump.
Tips to Make the Most of It:
1️⃣ Load up your RAY bags while it’s still affordable.
2️⃣ Focus on Spot, protect yourself from potential liquidations, and stay disciplined.
3️⃣ Follow the signals and seize the opportunity at the right moment.
All signs point to a major move on the horizon – RAY is ready to take off! Don’t miss your chance to get in before the breakout. COINBASE:ETHUSD BINANCE:SOLUSDT BINANCE:BTCUSD

RAYUSDT: Bullish Symmetrical Triangle FormationRAY/USDT is currently forming a bullish symmetrical triangle, indicating potential upward momentum. This pattern suggests a breakout to the upside as buyers and sellers reach a point of equilibrium.

Raydium (RAY) Analysis – November 2024Raydium (RAY) Analysis – November 2024
The chart highlights that RAY has experienced a significant upward movement, currently trading at $4.801 after a notable surge of +49.28%. This rise has propelled it above a key resistance zone near $3.5, which now acts as a support.
Key Observations:
Resistance and Potential Targets: The breakout above $3.5 suggests a bullish momentum. If this trend continues, RAY could reach higher targets around $6.5.
Pattern Formation: The current trajectory appears to align with a "cup and handle" pattern, typically indicative of further bullish continuation.
Next Moves: A successful consolidation above the current breakout level could pave the way for another leg up, while a fallback below $3.5 might signal the need for caution.
Conclusion:
RAY's recent momentum positions it for potential further gains, contingent on its ability to maintain above the breakout level and continue capitalizing on bullish market conditions.
#Raydium #RAY #Crypto #TechnicalAnalysis #PriceTargets

Here I buy Raydium at $4Here I buy Raydium at $4
My buy orders are starting from $4
Selling orders getting filled
I think I'm triggering Raydium supply shock
The wait is over
and after all the talk, all I gotta say is
you're welcome you're all welcome
Like I always do at this time
i go for mine
I got to shine
now throw yo hands up in the skyyyyyyyy

Raydium Double-Top, Low Risk 4X SHORT—140% PotentialLadies and gentlemen, we are going to add a new pair to our list of public SHORTs. We have about five already.
SHIBUSDT, PEPEUSDT and BNBUSDT all hit the first target and are doing good. I think SOLUSDT is no good right now and RUNEUSDT also hit the first target. ETHUSDT is in the green but hasn't hit any targets yet, it will soon.
To this list, we are now adding Raydium, RAYUSDT. The tile says it all. This SHORT is based on a double-top or lower high. Look how big is the shadow of the last peak, something similar can happen again. Or it can happen that the pair ends in a lower high; whatever happens, down it will go next.
The way to end up with a sure profit is by using low lev. If you use high leverage the whales will manipulate the market until your position is liquidated. If you use low leverage you can win this and many other trades.
It is very important to win in order to develop a winning feeling, to get in the flow. If you are in a hurry and hoping always to hit it big, you can never get a win and instead lose over and over and this makes it even harder to achieve success. Instead of making it big, making money fast and making money with 100X, make several small moves, 2-3X, that's ok. Get on the habit of winning and withdrawing and staying calm with a stable mind and this will open the doors for higher leverage and big gains.
If you can't appreciate the small, you won't be able to spot the opportunities that will make a difference for you. If you cannot wait, you cannot trade. Patience is key.
No more platitudes... Full trade-numbers below:
➢ SHORT RAYUSDT
Leverage: 4X
Entry levels:
1) $3.333
2) $.3110
3) $2.950
Targets:
1) $2.830
2) $2.662
3) $2.400
4) $2.175
5) $1.950
Stop-loss:
Adjust to your own risk tolerance
Potential profits: 140%
Capital allocation: 3%
____
Disclaimer: Take a shower, brush your teeth, buy a house, open a company, get to work... Wait a minute, what is this? I cannot order you around and you cannot order me. We are all adults, you do what you believe is right and your are responsible for your own actions.
Trading is not for kids, it is a game for adults. There is big risk involved with leverage and mistakes can lead to loss. If you can't afford to lose money, do not trade. I am not responsible for your actions, I am only sharing numbers and letters, information, you can either use them or ignore them, but this is not financial advice.
Thank you for reading.
Namaste.

This #1 Crypto Is Going UpTrading crypto crypto can be a challenge
especially if you are not sure if the project will work
well or not.
This crypto BINANCE:RAYUSDT
is about to do a launch coming in about a week or so
its because of this launch
that's why I think its a possible good buy.
Also, it follows the rocket booster strategy
The rocket booster strategy has 3 steps:
-The price has to be above the 50 MA
-The price has to be above the 200 MA
-The price should gap up in an uptrend.
If you want to understand the uptrend of any price action
then this is the system to follow if not then
you will have to develop your own system to understand
whether the price is in an uptrend or not.
Rocket boost this content to learn more.
Disclaimer:
Trading is risky you will lose money wether you like it
or not please learn risk management and profit-taking strategies.

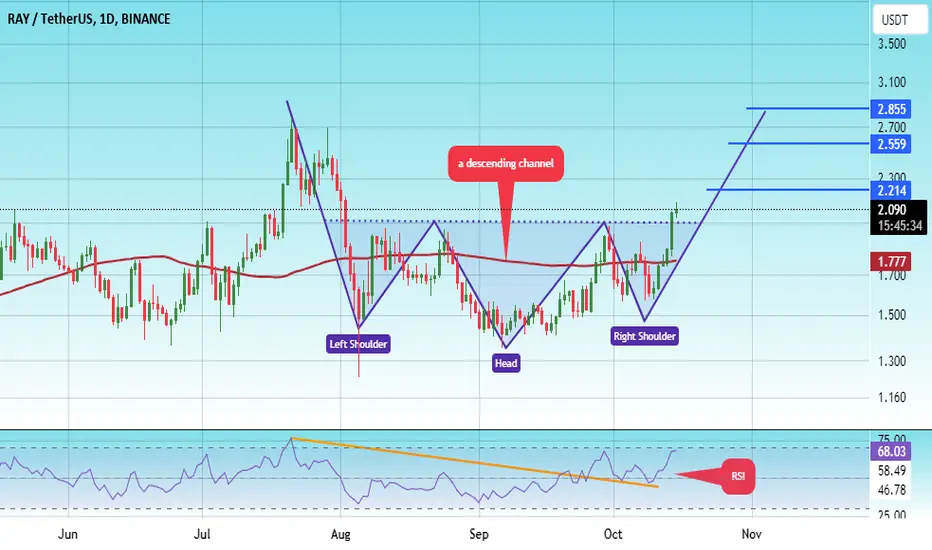
#RAY/USDT#RAY
The price is moving in a descending channel on a 1-day frame
It is adhering to it well and has completed the right shoulder
We have a bounce from the lower limit of the descending channel and we are now touching this support at a price of 1.52
We have a downtrend on the RSI indicator that is about to be broken, which supports the rise
We have a trend to stabilize above the moving average 100
Entry price 2.05
First target 2.21
Second target 2.55
Third target 2.85
Ray has formed CUP NASDAQ:RAY facing rejection from the resistance, it might fall for 2.4$ to complete the pattern, Over all sentiments are depend in #bitcoin movement, the rejection of bitcoin could make it turn into invalidity.

Raydium Looking Toppy (Top/High = Bearish)This is the type of pair to stay away from, Raydium (RAYUSDT), or, I should say, this pair looks bearish and can be good only for going SHORT.
Raydium grew a lot and is super bullish. It grew since late 2023 after a long period of consolidation and is now trading at high prices. When prices were low, this would have been a great option to buy. Now that prices are high, it is no longer a good option, right now is the time to sell.
We can see strong green candles now on a daily basis, volume is low. We can see a parabola and prices never move straight up. It can peak today, tomorrow or in a few weeks (likely soon), but there is way too much resistance right ahead. This is the type of pair that we either SHORT or stay away.
It is more likely than not to crash soon.
I hope you find this information useful (take profits!).
Thank you for reading.
Namaste.
