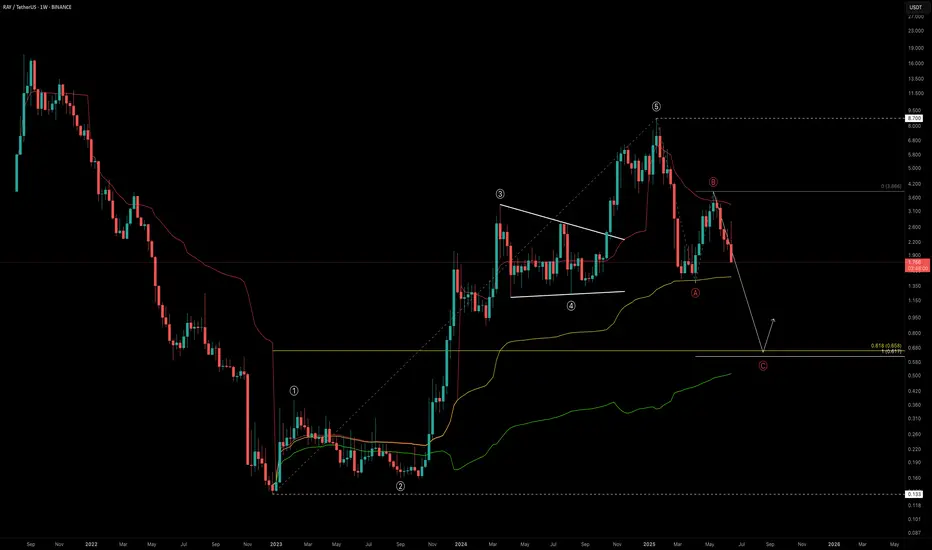
RAY Outlook: Is a -60% Drop the Reset We Need?RAY marked its bottom in December 2022 at just $0.133, entering a prolonged accumulation phase that lasted nearly a year. Then, in late 2023, it broke out into an explosive bull run, skyrocketing +6421% over 756 days and peaking at an impressive $8.70.
This run completed a full five-wave Elliott Wa
Related pairs
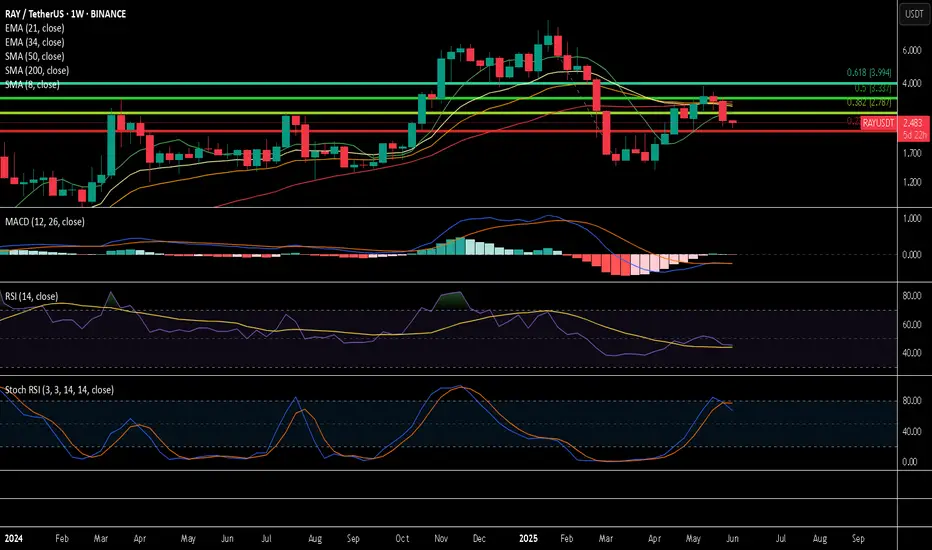
RAY Technical Analysis on a Weekly Timeframe.Hello Traders,
Today, let’s analyze RAYDIUM (RAY) on the weekly timeframe.
RAY has been one of the more consistent projects in the market. The price is currently sitting at the support trendline and just below the 21 EMA resistance. At this point, it’s clear that for a bullish move, the price must

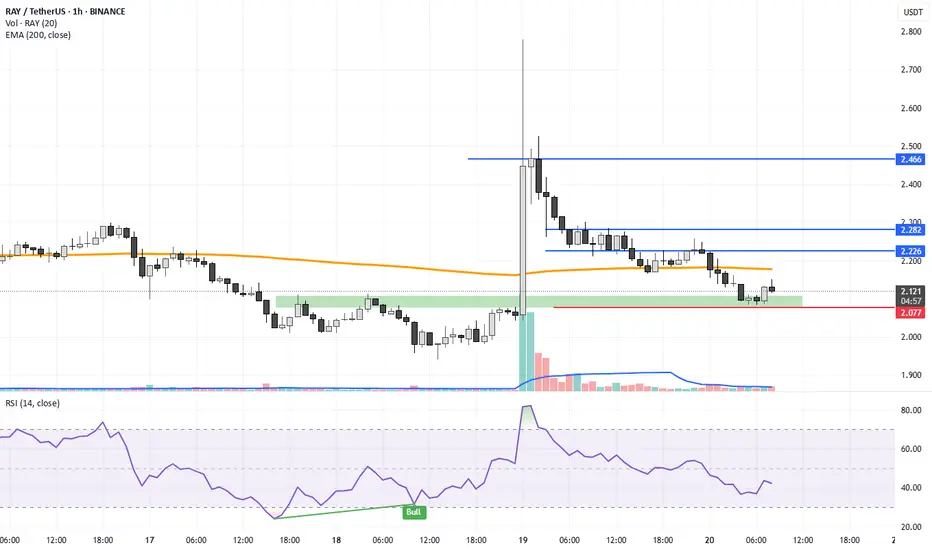
RAYUSDT 1W AnalysisRAY ~ 1W Analysis
#RAY Buy back gradually from this support block with a short term target of at least 15%+ from here.

RAYDIUM is looking for support. Watchlist material. RAY is looking to find its bottom. RR is in favour of a long. Horizontal support is a clear invalidation of the bullish thesis. A break below confirms a lower low.
Full TA: Link in the BIO

RAY the end or just the start?To first look at Ray we can start with RAYUSDT and move to RAYSOL and RAY BTC.
RAY is not sitting below all of the moving averages. Not an ideal position.
So far MACD cross down does not mean much as the week has not ended yet. Ideally to stay bullish it need to end the week not crossed d
RAYDIUM LONG SETUP ALL trading ideas have entry point + stop loss + take profit + Risk level.
hello Traders, here is the full analysis for this pair, let me know in the comment section below if you have any questions, the entry will be taken only if all rules of the strategies will be satisfied. I suggest you keep thi

RAY (Raydium) – Long Swing Trade Setup from Major SupportRAY is trading at a major support zone between $2.85 – $3.25, which historically has acted as a base for significant upward moves. With strong support beneath and favorable upside targets, this presents a solid long swing opportunity with clear invalidation.
🔹 Entry Zone:
$2.85 – $3.25 (key support


Breaks Out of Red Resistance Zone 🚨 NASDAQ:RAY
Breaks Out of Red Resistance Zone 🚨
NASDAQ:RAY
has successfully broken out of the red resistance zone, which was part of a symmetrical pattern. This breakout could signal a strong bullish move.
📈 Technical Overview:
Pattern: Symmetrical
Breakout Level: Red resistance zon

See all ideas
Summarizing what the indicators are suggesting.
Oscillators
Neutral
SellBuy
Strong sellStrong buy
Strong sellSellNeutralBuyStrong buy
Oscillators
Neutral
SellBuy
Strong sellStrong buy
Strong sellSellNeutralBuyStrong buy
Summary
Neutral
SellBuy
Strong sellStrong buy
Strong sellSellNeutralBuyStrong buy
Summary
Neutral
SellBuy
Strong sellStrong buy
Strong sellSellNeutralBuyStrong buy
Summary
Neutral
SellBuy
Strong sellStrong buy
Strong sellSellNeutralBuyStrong buy
Moving Averages
Neutral
SellBuy
Strong sellStrong buy
Strong sellSellNeutralBuyStrong buy
Moving Averages
Neutral
SellBuy
Strong sellStrong buy
Strong sellSellNeutralBuyStrong buy
Displays a symbol's price movements over previous years to identify recurring trends.
Frequently Asked Questions
The current price of Raydium / USD Tether (RAY) is 2.1384 USDT — it has risen 2.87% in the past 24 hours. Try placing this info into the context by checking out what coins are also gaining and losing at the moment and seeing RAY price chart.
Raydium / USD Tether price has risen by 10.66% over the last week, its month performance shows a −24.60% decrease, and as for the last year, Raydium / USD Tether has increased by 31.36%. See more dynamics on RAY price chart.
Keep track of coins' changes with our Crypto Coins Heatmap.
Keep track of coins' changes with our Crypto Coins Heatmap.
Raydium / USD Tether (RAY) reached its highest price on Nov 3, 2021 — it amounted to 13.4230 USDT. Find more insights on the RAY price chart.
See the list of crypto gainers and choose what best fits your strategy.
See the list of crypto gainers and choose what best fits your strategy.
Raydium / USD Tether (RAY) reached the lowest price of 0.1335 USDT on Dec 29, 2022. View more Raydium / USD Tether dynamics on the price chart.
See the list of crypto losers to find unexpected opportunities.
See the list of crypto losers to find unexpected opportunities.
The safest choice when buying RAY is to go to a well-known crypto exchange. Some of the popular names are Binance, Coinbase, Kraken. But you'll have to find a reliable broker and create an account first. You can trade RAY right from TradingView charts — just choose a broker and connect to your account.
Crypto markets are famous for their volatility, so one should study all the available stats before adding crypto assets to their portfolio. Very often it's technical analysis that comes in handy. We prepared technical ratings for Raydium / USD Tether (RAY): today its technical analysis shows the neutral signal, and according to the 1 week rating RAY shows the sell signal. And you'd better dig deeper and study 1 month rating too — it's neutral. Find inspiration in Raydium / USD Tether trading ideas and keep track of what's moving crypto markets with our crypto news feed.
Raydium / USD Tether (RAY) is just as reliable as any other crypto asset — this corner of the world market is highly volatile. Today, for instance, Raydium / USD Tether is estimated as 3.48% volatile. The only thing it means is that you must prepare and examine all available information before making a decision. And if you're not sure about Raydium / USD Tether, you can find more inspiration in our curated watchlists.
You can discuss Raydium / USD Tether (RAY) with other users in our public chats, Minds or in the comments to Ideas.