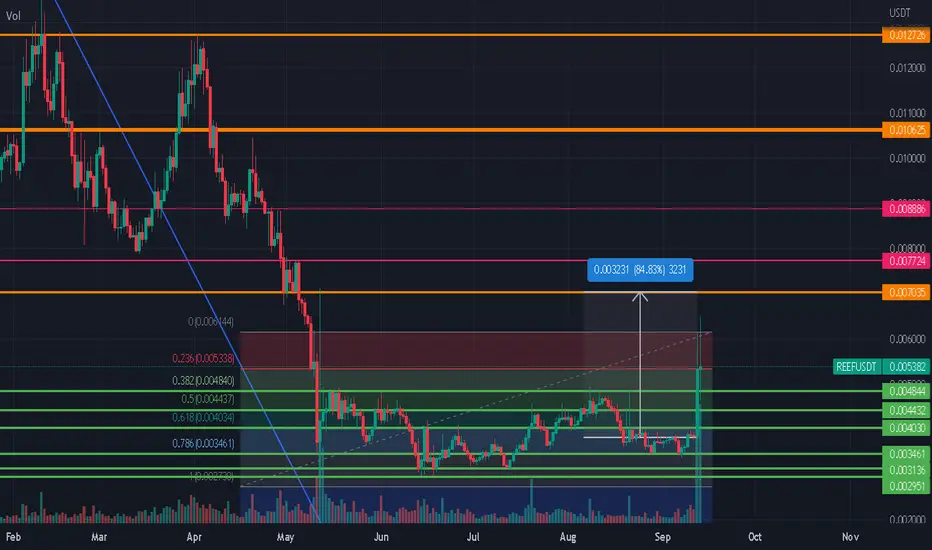
REEFUSDT LEVELS TO WATCH CURRENTLYprice bounced off from fib 0.382 which was at 0.004840 & now its getting rejected around 0.0065.
if price continues goes up den you can consider selling your positions at above resistance areas level by level.
NOTE - It pumped hard and it will retrace for sure. Better to take some profits on the table.
REEFUSDT trade ideas
Cup and handle4hr time frame has bullish divergence and the daily as hidden bullish divergence. I see bullish patterns forming on the smaller time frames. Daily had a bullish cross on MACD. There is no breakout yet so keep an eye out for that. 1hr 20,50,100 and 200 EMA getting tight together with a bull pennant on 1hr.

REEF/USDT Update 📈📉HEY, Sup Guys and Girls?!
Since 07 may 2022 , that I've posted the previous analysis for Reef , it has been declining till now and wasn't able to continue its uptrend and maintain the pivot zone and then according to my bearish scenario it massively dropped on the lower support levels ( more than 70 %💰 (1x-short ))🎯 .
so now As you can see on the weekly timeframe for reefusdt, it is already trading below the pivot zone , and the overall trend of crypto market is still bearish so it can fall more on the lower support lines , but if bulls be able to raise the price and breakout the pivot zone and as well as the descending trendline , then it can reach the higher resistance zone .
✌️ Good luck with your trading and investing and remember: Trade smart…OR JUST DON’T TRADE!
--------------------------------------------------------------------------------------------------------------------
👉This analysis is my personal opinion ,not a financial advice ,so do your own research.
💜 if you're fan of my analyses please follow me , give a big thumbs 👍 OR drop a comment 🗯

REEFUSDTSmall cap that did not pump yet. Good volume increase lately and volatility contraction in daily. Good R/R

FEEF LONGThere is always the possibility of failure, but it may be the best buy in the short term
The worst case scenario can always be easily changed
Follow

$REEF CHART pretty self explanatory
D1 cross
downtrend about to be broken
lots of setups like this not in this trade at present since already deployed
$67 mill Mcap and this one behaves like a chad

REEFUSDT wants the Demand Zone?The price had a rejection from the dynamic and static resistance on the 4h timeframe and now the market is testing the daily support above the 4h support on 0.36$
The price created a double bottom above 0.003$ area where the market created a demand zone.
How to approach?
IF the price is going to lose the support and retest the support as resistance, we could see a new bearish impulse until the demand zone for the new liquidity, so According to Plancton's strategy , we can set a nice order
–––––
Keep in mind.
🟣 Purple structure -> Monthly structure.
🔴 Red structure -> Weekly structure.
🔵 Blue structure -> Daily structure.
🟡 Yellow structure -> 4h structure.
–––––
Follow the Shrimp 🦐

REEF big things loading... its only my opinion!REEF big things loading... its only my opinion! i am long

REEF has formed big Gartley for upto 3823% massive moveHi dear friends, hope you are well and welcome to the new trade setup of Reef token.
On a monthly time frame, REEF has formed a big bullish Gartley pattern.
Note: Above idea is for educational purpose only. It is advised to diversify and strictly follow the stop loss, and don't get stuck with trade

REEF / USDT Support & ResistancesDaily Technical Outlook with possible targets - 03.06.2022
Note: Please watch Pro-Technical video on Cryptosocy platform first

REEFUSDT is creating a triangleThe price is creating an ascending channel below the daily resistance of 0.005$.
As you can see the daily area is very strong for the market, and the price got several rejections from that area.
How to approach it?
IF the price is going to have a breakout from that area, According to Plancton's strategy , we can set a nice order
–––––
Keep in mind.
🟣 Purple structure -> Monthly structure.
🔴 Red structure -> Weekly structure.
🔵 Blue structure -> Daily structure.
🟡 Yellow structure -> 4h structure.
–––––
Follow the Shrimp 🦐

REEFUSDT is testing 1.618 Fibonacci EXTThe price is testing the 1.618 Fibonacci EXT level, it's a key level on the Daily timeframe , on 0.00357.
On the 4h timeframe, the price is testing the 4h support and creating equal lows above the demand zone .
How to approach it?
The price could create a new bearish impulse to grab new liquidity from 0.0035 and start with a reversal trade, According to Plancton's strategy, we can set a nice order
–––––
Keep in mind.
🟣 Purple structure -> Monthly structure.
🔴 Red structure -> Weekly structure.
🔵 Blue structure -> Daily structure.
🟡 Yellow structure -> 4h structure.
–––––
Follow the Shrimp 🦐

REEF / USDT DAILYREEF / USDT DAILY We hope you find our charts of use, please hit the like button if you found this chart useful. Safe trading everyone Check today's analysis below.⠀


#REFF/USDT UPDATE Hi guys, This is CryptoMojo, One of the most active trading view authors and fastest-growing communities.
Do consider following me for the latest updates and Long /Short calls on almost every exchange.
I post short mid and long-term trade setups too.
Let’s get to the chart!
I have tried my best to bring the best possible outcome in this chart, Do not consider it as financial advice.
BUY REEF/USDT
Entry range:- $0.0510TO $0.0550
Long term target:–500%
Mid Enter target:–150%
Short term Target:- 50%
SL:- $0.0470
This chart is likely to help you in making better trade decisions if it did consider upvoting this chart.
Would also love to know your charts and views in the comment section.
Thank you

$REEF FINANCEreef near the bottom of the descending channel
should the market turn I would expect reef to challenge the resistance line
should resistance be broken then a visit to the top of the channel is possible
if the top of channel can be broken then reef could visit fib targets .10 / .20 / .50

Reef is about to explode!Double top! Reef has retested this situation in the past and it is now about to break an important trend line!
Watch for 0.0092 as a resistance!!!

REEF/USDT HAS POTENTIAL TO PUMP 160%!Hi guys, This is CryptoMojo, One of the most active trading view authors and fastest-growing communities.
Do consider following me for the latest updates and Long /Short calls on almost every exchange.
I post short mid and long-term trade setups too.
Let’s get to the chart!
I have tried my best to bring the best possible outcome in this chart, Do not consider it as financial advice.
BUY REEF/USDT
Entry range:- $0.00820 TO $0.00790
Target:- 166%
SL:- $0.00750
This chart is likely to help you in making better trade decisions if it did consider upvoting this chart.
Would also love to know your charts and views in the comment section.
Thank you

REEF possible playout REEF USDT pair chart looks interesting almost at Demand Zone and All the time low price clearly can see 1D RSI divergence high probability to reach all three target very soon

REEFUSDTREEF above the bulish block order which give good reversal sign
bulish harmonic pattern
the targets and ris on the chart.
Good luck


REEFUSDT is creating a cup and handleThe price is testing important support on the daily timeframe on 0.008$.
On the 4h timeframe the price got liquidity from 0.786-0.886 Fibonacci level and retest again the daily resistance on 0.0096.
Now the price is going to create a cup and handle patter, the price is testing the 0.618 Fibonacci level after the election from the daily resistance and dynamic 4h resistance.
How to approach?
The price needs to have a breakout from the resistance and retest the previous daily resistance as new support. According to Plancton's strategy , we can set a nice order
–––––
Keep in mind.
🟣 Purple structure -> Monthly structure.
🔴 Red structure -> Weekly structure.
🔵 Blue structure -> Daily structure.
🟡 Yellow structure -> 4h structure.
–––––
Follow the Shrimp 🦐

Reef LongHello my friends. Glad to be with you.
I publish a potential REEFUSDT trade:
Entry - $0.012014
stop - $0.01157
TP-1 - $0.01297
How do you think?
I am waiting for your thoughts and graphs in the comments!
