REEF Candle Close in a PitchforkI see some nice support levels within the pitchfork.
Big push will come when that BLUE trend line is conquered and pushing past $0.05 will be even more explosive. Cup and Handle should complete formation at $0.40 right around that upper band and fib.
Taking profits along the upper band of pitchfork and reinvesting on dips would be an option.
Good Luck!
REEFUSDT trade ideas


Reef is ready to 🚀(Spot)Reef is undervalued and insane in pumps!
Personally, will not enter with a large amount here due to possibility of bitcoin falling and the orange scenario.
so please make sure you buy after breakout.
This guy will be so bullish until that uptrend line is broken. If orange scenario occurs I'll buy the dip :)

Reef buy Signal for Spot tradersReef is currently on a support (0.3441 region), using candlestick analysis, the pinbar candle signal has formed, signalling a continuation of the initial trend, buy around this region, the takeprofit region is shown by the arrow.. more Profits guys! BINANCE:REEFUSDT

REEF USDTMy idea about REEF finance, i think is very strong project with future. 0,70 $ is very possible.
What do you think about my idea?
Thanks for the comments.
This is not financial advice.

REEF can PUMP from here, or even go to MOON like SHIBA !!!as we can see reef broke and sucessfully retest the channel and can pump from here to our TPs, but if we look long timeframes we can see REEF IS SO SIMILAR with SHIBA INU and IF major resistance in TP2 breaks we go straight to moon and 10x our money, DONT LOOSE this trade its so potential my friend.
like and follow , THANK YOU

$REEF to 0.3$ / 0.6$One day it will just go crazy, be sure ;)
As always, buy only after you done with your own research
#DYOR !!

REEF +150% ???Reef retesting midline now. If we get support from here we can go MOON!
Reef will announce their metaverse soon! Thats bullish news :) Patiance is key!

REEFUSDT - 1D - Buy the breakoutHi guys,
Flag forming with reef against usdt
If breakout, price will target the red zone.
(Depending on btc too)
Like and subscribe if you share
NFA


reef scalpanother reef scalp setup,open position when price drops below 200ema,otherwise wait for retest of flag's res

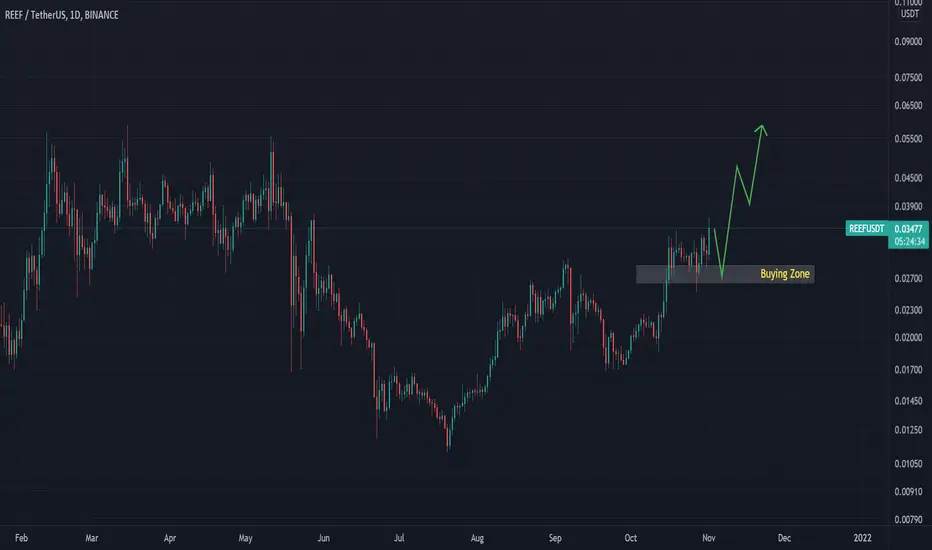
REEF UPDATE another buying zone for probable wave patternsREEF UPDATE another buying zone for probable wave patterns
Reef price has been hanging around 61.8 fib retracement it can go down to 78.6 retracement.
I hope that the downward has already ended or at most 78.6 retracement which I will stack more reefs.


CAN REEF GO FOR THE PREVIOUS ATH?REEF is sitting at a very strong supply zone here with a horizontal trendline, breaking out of this with volume will be really bullish and will take us for the next supply zone where we had the previous ATH!
All eyes on REEF, it has been the slowest mover of all!


REEF USDT Long SetupREEFUSDT looking for a slight dip to Buying Zone
As long as the price is above 0.026
Upper targets 0.05 is achievable
REEFUSDTREEF Outlook Transition, You Just need patient To wait It BreakOut
For Make Confirmation
KEEP DESCLAIMER ON

reefusdtHi Dear followers,
I think this will be Reef's Path. Details can be seen on the chart.
Wish you all luck and Profit.
all the best


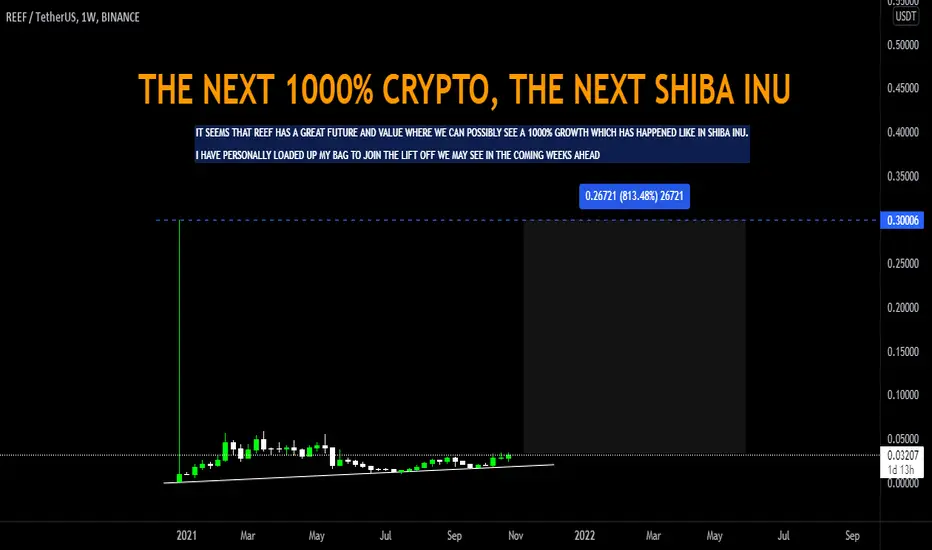
REEF IS THE NEXT 1000% CRYPTO, LIKE SHIBA INU. FOMO 🚀🚀Welcome to Aureate Invest.
Charts published are based on technical factors using patterns, structures and price action and no chart is 100% guaranteed and market volatility can change the trade setups or plans anytime. We share the charts and analytics for education purposes while you should follow them at your own risks. We always recommend doing your own analysis before investing in high risked market instruments.
Pin your opinions and suggestions under the comment section. Also we do appreciate further support on our chart interpretations by following and hitting on the like button.
Another bullReef already made compression. Waiting time to break resistance. Hopefully it can make it.

REEF/USDT Getting ready for a breakout. All signs show upwards🚀Intro:
- Reef Finance tries to become one of the most used blockchains for DeFi.
It's fast, scalable and has a low transaction costs.
Reef Finance is build with Polkadot Substrate and comes with on-chain governance.
- SEC confirmed that crypto will not be banned which is positive for the whole crypto market.
- DeFi projects appreciated a lot of attention during the first quarter of 2021 and probably will again during Q4.
- In circulation we have 13billion coins out of possibly 16-20 billion. Therefore we don't expect a strong pullback due to inflation.
- Total market cap is around 400million which seems too low.
Daily chart:
- Price shows a consolidation around the 0.03$. We did retest the old resistance around 0.025$ which turned into support.
- Volume shows a price spike together with price appreciation. Often times this is followed by a second round of prices spikes so we are watching closely. The chances we see this during the next days are pretty good.
- RSI analysis shows that bounced back from the red 80 line. We found support around the 50 line and get ready to go back up again.
- Support lines are at 0.025$?, 0.02$, 0.0165$ and 0.0135$. The ascending yellow line can act as support as well.
- Resistance lines are at 0.05$. Clear sky lies beyond.
Expectation:
- We expect another leg up after the current consolidation. All signs show strength and upwards momentum.
- DeFi will get more attention during Q4 again and not only for Tax reasons.
- We expect some consolidation around 0.03$ before we get through and a struggle around 0.05$. So far we see exactly that.
- End of the year prediction: We will see a 0.3$+ REEF before the end of 2021.
Basic rules:
- Never buy the top/ ATH
- Take profit as long as you can (also partial profit is profit)
- Use Stop/loss for leveraged positions
- If you are not experienced, don't leverage in the first place
Enjoy the ride and don't be too greedy.
If you like the content, please like, comment and give this channel a follow.
We would love it if you could share your thoughts in the comments.
Discussions are very welcome here.
Always do your own research and keep in mind that my charts and comments cannot be considered financial advice.
Cheers
ps.
Chart explanation:
Main lines:
- Green lines are tested support lines.
- Orange lines are resistance lines or, if we are above, possible support lines which were not tested yet.
- Cyan line is for volume trendline.
- White lines are Fibonacci retracement levels
Helplines:
- Purple lines are trendlines we take a look at.
- Blue, green, white and pink lines are 200MA, 100MA, 50MA and 20MA.
- Yellow lines are for visual help only.
Specials:
- Boxes represent either entry zone or support zone . Check the description.
- Cameras represent MA crossings. Yellow camera stands for a golden cross while the cyan camera stands for a death cross.
