ReefReef is currently in the very strong supply area. As you can see in the chart the price already touch the trendline and also the old support which acting as a resistance area. Reef needs a lot of volume and good FA before breaking this area. Dumping can be very possible due to the reason of whales are selling.
REEFUSDT trade ideas

#REEF/USDT keeps dumping in 4-Hour TF!#REEF/USDT keeps dumping in 4-Hour TF!
$REEF needs to clear the Diaognla trendline to turn bullish. Wait for BO, to add some in Spot and Long. The local resistance level is PWH 40.00836.

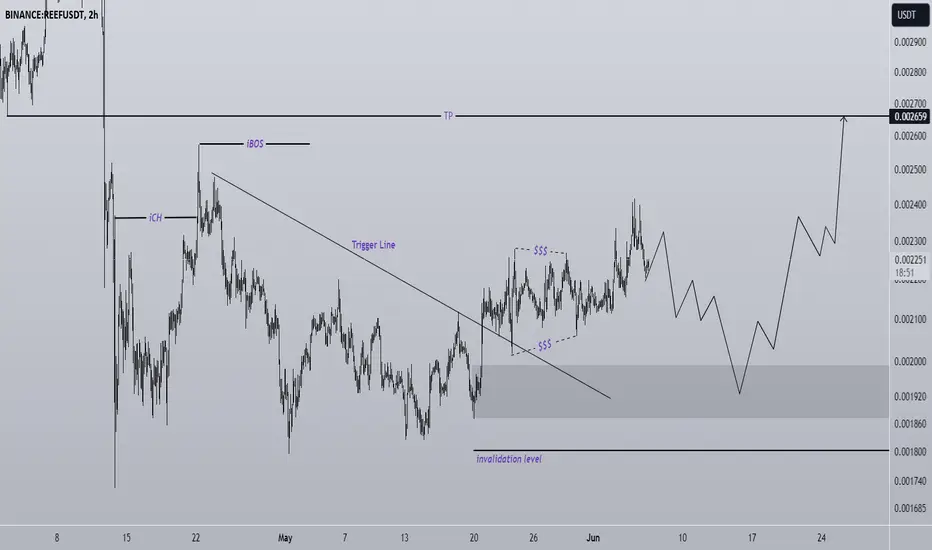
REEF roadmapFrom where we put the red arrow on the chart, it seems that REEF correction has started.
This correction seems to be a large diametric that price has now entered wave E of this diametric.
It can continue to drop by maintaining the supply range.
Closing a daily candle above the invalidation level will violate the analysis.
For risk management, please don't forget stop loss and capital management
Comment if you have any questions
Thank You

REEFUSDT 1W-TIMEFRAME ANALYSIS💥REEFUSDT 1W-TIMEFRAME ANALYSIS
💗Hello ladies and gentlemen
This is my new idea for 💥REEF Reef
I hope my idea is clear
Support me by like and share thank you
Stay Safe💯💲💲💲
Good luck💰😍

Reef local swing tradeOnly if we will not see delisting! because reef long time period under monitoring tag
BINANCE:REEFUSDT
Possible Targets and explanation idea
➡️Local fib on daily, im waiting test green block "buy area"
➡️Sweep liquidity pool inside green block
➡️No money inflow on MP indicator
➡️Take Profit indicator I would like to see retest buy line
Hope you enjoyed the content I created, You can support with your likes and comments this idea so more people can watch!
✅Disclaimer: Please be aware of the risks involved in trading. This idea was made for educational purposes only not for financial Investment Purposes.
---
• Look at my ideas about interesting altcoins in the related section down below ↓
• For more ideas please hit "Like" and "Follow"!

REEF SPOT IDEEA🔍 Spot Signal for #REEF/USDT
Analysis:
📈 #REEF has consolidated over a long period. The timing is perfect to buy now. A bullish breakout is expected to start a rally up.
📊 Bullish Breakout: We anticipate a bullish breakout that could trigger a significant upward movement. It’s important to wait for confirmation of this breakout to avoid false signals.
🔄 Major Resistance: There are several resistance levels to watch as the price evolves.
🔑 Recommendations:
Entry: Given the prolonged consolidation and the current timing, it is recommended to buy REEF now.
Targets:
First target: $0.001550
Second target: $0.001800
Third target: $0.002400
Strategy: Monitor the breakout signals and adjust your positions as the price develops. Use analysis tools to make informed decisions and manage risk effectively.

REEFUSDT is BullishPrice has given a breakout from the trendline, and has also broken previous lower high. Bulls are in control of the price action, and hence more highs are expected in coming days as per Dow theory. Targets are mentioned on the chart.

Reef Usdt long potential Hi everyone
this is not a financial, investment, trading, or other types of advice or recommendations
this is my idea
and its my art and way of seeing market today
trade with your plan

REEF Yearly Vwap SnapReef is looking to pull back, hit an order block below then begin its climb to the Yearly vwap snap point 217% ish above.
The chart is close up but this play will require you to shrink and scroll the chart by the time it reaches its destination.
Watch for BTC's soon well needed correction. Maybe this will trigger your entry on REEF after pullback.
Happy Trading
*not financial advice
I only draw cartoons

ReefUsdti am very very bullish on this project.
A clear buy at 0.00155-65 range.
It has a potential to go up to 0.05.
30x profit waiting for you.
Buy Reef and hold.
I can see bullish divergence too so don't wait start DCA from today and hold this coin bag...

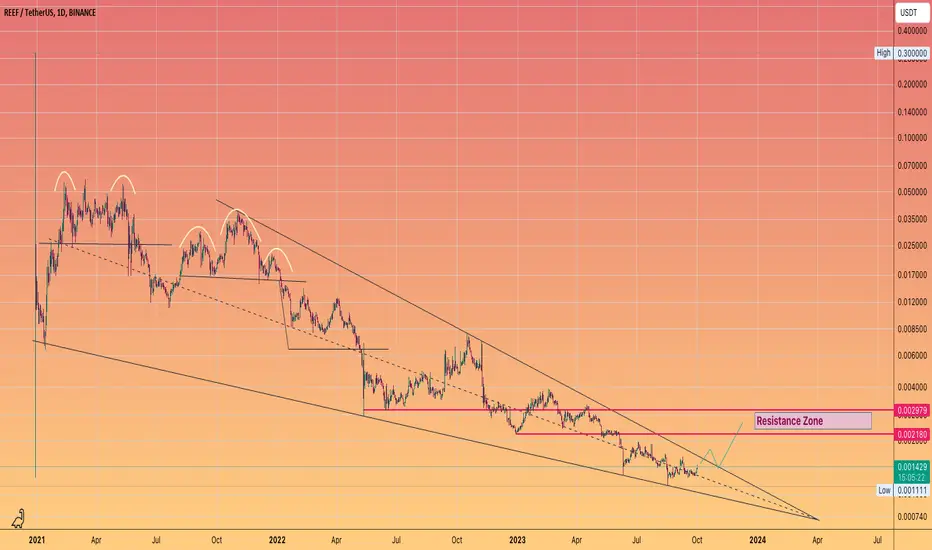
still consolidatingFrom one day time frame, we can see there is an ascending channel within the consolidation, also a 2b pattern formed where it touched the resistance for the second time but with far lower buying power. and a clear rejection formed. This indicates Reef has not finish its consolidation, where it would be heading down for the lower resistance.
Although one can never predict the market, I believe in a bullish market like this year, eventually it would rally up, but for now it is best to looking for opportunities within the lower bond of the consolidation. I believe Reef needs to at least touch the lower resistance or get close to the latest lower point for a liquidity grab.

REEF buy setupREEF structure looks bullish on hourly time frames.
We have a bullish iCH on the chart and the trigger line is broken.
By maintaining the demand, it can move towards the targets.
Closing a 4-hour candle below the invalidation level will violate the analysis.
Note that the financial market is risky, so:
Do not enter any position without confirmation and trigger.
Do not enter a position without setting a stop.
Do not enter a position without capital management.
When we reach the first TP, save some profit and try to move the stop continuously in the direction of your profit.
If you have any comments please post them, comments will help us improve our performance
Thanks
Reef - Bull flag - 200%On the above 1 day chart price action has corrected 60% since early April. A number of reasons now invite a long position. They include:
1) Price action and RSI resistance breakouts.
2) Price action confirms support on past resistance. Once the horizontal 2nd the diagonal.
3) The flag. The breakout is clear to see with the flagpole extension measuring a 200% target area. Remember targets do not equal market tops.
Is it possible price action continues to correct? Sure.
Is it probable? No.
Ww
Type: Trade
Risk: <= 3%
Timeframe for long: days
Return: 200%

REEF#Reef seems very bullish, under valued good project.
Recently exhibited significant market dynamics, bouncing from a support area. However, before continuing its upward trajectory, REEF needs to break out of the resistance area.
The price is moving near the minor resistance level of $0.002250 - $0.002350. Its upward rally has not yet started, and it is a very good opportunity to buy
A successful breakout could pave the way for a bullish move .

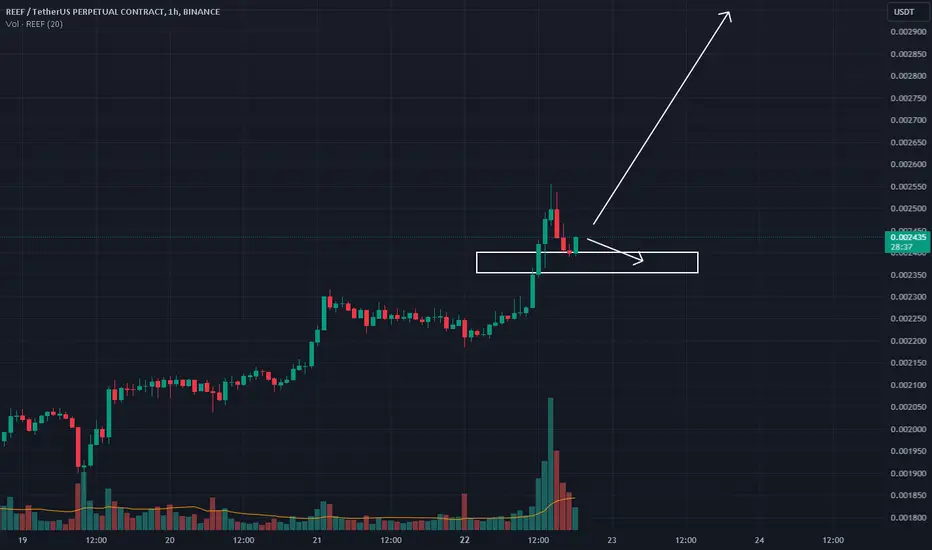
REEFUSDTHM signal v4.0 (High momentum) spotted. Looking good with previous wave up with increasing volume and momentum.
- Heathy retracement and support well at good level @ 0.002354-0.002400
- Trending slow and steady if able to hold above the support zone
It is at extremely good reward to risk level now if able to hold above the support level.
ReefReef seems very bullish, under valued good project, I think will reach 0.005, 0.007 and 0.01 very soon in beginning of alt season.
watch the bitcoin price and dominance, stay safe
* just my opinion not financial advice

REEF/USDT If break the resistance, indicating continue upward!💎 REEF has recently exhibited significant market dynamics, bouncing from a support area. However, before continuing its upward trajectory, REEF needs to break out of the local resistance area.
💎 A successful breakout could pave the way for a bullish move, probability leading REEF to retest the bearish order block (OB) area.
💎 On the other hand, if REEF fails to break above the resistance, there's a possibility of price rejection, prompting a test of the support around the $0.0027 area.
💎 The situation could worsen if REEF breaks below the support, leading to a retest of the demand area. Reclaiming the price above the support would signal a potential return to an upward trend.
💎 However, a breakdown below the strong support level would confirm a bearish trend, potentially resulting in further price declines.

REEF/USDT Indicating Bounce and continue upward movement.💎 REEF has recently exhibited significant market dynamics. Currently, it has bounced after retesting the demand area around $0.00316.
💎 If this bounce holds, it's probability that REEF will resume its upward movement and retest our target area.
💎 However, if REEF fails to maintain this support area and breaks down below $0.00316, it could signal a bearish trend continuation. In such a scenario, the next potential support area is around $0.0023.
💎 At the support area, it's crucial for REEF to bounce and reclaim the area above the demand zone to sustain its upward momentum. However, if REEF fails to do so and breaks down below the support, it could lead to further downward movement.

ScalpAccording to the waves analysis we can expect that price rise again to the green zone
This is my personal opinion and is not an offer to buy or sell, please act according to your trading plan
follow me for more ideas

REEFUSDT.1DBased on the provided market data, the current price of the cryptocurrency REEF is $0.0041. The Relative Strength Index (RSI) is a momentum oscillator that measures the speed and change of price movements. The RSI for REEF over 4 hours, 1 day, and 7 days is 60.17, 82.82, and 77.84 respectively. An RSI value above 70 generally indicates overbought conditions, suggesting a possible sell opportunity, while a value below 30 indicates oversold conditions, suggesting a possible buy opportunity. The RSI values, especially for 1 day and 7 days, are quite high indicating overbought conditions.
The Moving Average Convergence Divergence (MACD) is a trend-following momentum indicator. The MACD values for REEF over 4 hours, 1 day, and 7 days are 0.00033, 0.00054, and 0.00028 respectively. Positive MACD values indicate bullish conditions and the potential for a buy opportunity, which aligns with the current MACD values.
The Bollinger Bands (Bb) are a volatility indicator. The Bb values for REEF over 4 hours, 1 day, and 7 days are 0.0052, 0.0052, and 0.0053 respectively. The current price is below the Bb values, indicating bearish conditions.
The support levels are the price levels at which demand is thought to be strong enough to prevent the price from falling further. The resistance levels are the price levels at which selling is thought to be strong enough to prevent the price from rising further. The current price is closer to the first support level for 4 hours, 1 day, and 7 days, indicating bearish conditions.
In conclusion, the technical analysis indicates overbought conditions due to high RSI values, bullish conditions due to positive MACD values, and bearish conditions due to the current price being below Bb values and closer to the first support level. Therefore, it might be a good idea to wait for a better entry point before investing in REEF. However, this is purely based on the technical analysis and does not take into account any fundamental factors or potential news that could impact the price. It is always recommended to do your own research before making investment decisions.

#Altcoins are starting to move. Falling Wedge on #REEFKeep an eye for a potential breakout
There is always a chance for retest of the wedge
But first target would be the resistance at 0.00218 a good +50% move

REEF - Really break out!Dear my friends,
I bought REEF once at the price range of 0.0022 and waited for a break out. But it didn't do that. I'm still holding it. And today when observing REEF, I decided to enter another order and wait for it to x3 from the current price.
The reason is that it actually broke out, above the price line and also above the RSI.
I'll wait and continue my DCA strategy.
Best Regards,
