RENDER: Is the Correction Over?RENDER has surged nearly 20% at its peak recently. This prompts the question of whether the wave 2 correction low may already be in place. We continue to consider this scenario as our alternative outlook, in which we would anticipate direct gains above the resistance levels at $6.08 and $11.82 (probability: 40%). However, our primary expectation remains that a new low will be set within our magenta Target Zone (coordinates: $5.43–$1.81) before the projected upward moves unfold.
📈 Over 190 precise analyses, clear entry points, and defined Target Zones - that's what we do.
RENDERUSD trade ideas

RENDER Conditional longRENDER appears to be reacting to
the fibonacci levels. Currently finding
resistance @ the 382. If price starts to
break above this level I believe the next
natural step would be the 236
Conditional order long if we break
4.52 (which also represents a break of
a downtrend on the micro Timeframe -
zoom into the hourly)
Setting TP @ 6.3 which is just
underneath key resistance points.

RENDER conditional longRENDER appears to be reacting to the fibonacci levels. Currently finding resistance @ the 382. If price starts to break above this level I believe the next natural step would be the 236
Conditional order = long if we break 4.52 (which also represents a break of a downtrend on the micro Timeframe - zoom into the hourly)
Setting TP @ 6.3 which is just underneath key resistance points.
Is RENDER About to Explode? Here is What You Need to Know!Yello, Paradisers! Could this be the final shakeout before #RENDER kicks off a fresh rally? After weeks of heavy bleeding, we're now spotting a textbook bottoming structure — and if you're not paying attention, you might miss one of the cleanest setups we've seen in a while. Let’s break it down.
💎#RENDERUSDT is attempting to solidify a double bottom formation right at a strong historical support zone between $2.50–$2.65. This area has already shown its strength in the past, and now the bulls are trying to use it as a launchpad again.
💎But the real battle zone is at the $4.00 to $4.20 range. This isn't just another resistance. It's a pivotal multi-resistance zone acting as the neckline of the double bottom and is stacked with congestion from previous price rejections. For bulls to reclaim control, we need to see a strong breakout above $4.20 — ideally supported by increasing volume.
💎If that breakout plays out, the next target comes in at $5.10 to $5.40, where partial profit-taking is expected. However, if bulls remain in charge and manage to suppress any selling pressure, we could be looking at a push toward the $6.70 to $7.00 resistance — a level with significant historical relevance.
💎On the flip side, if the breakout fails and we revisit lower levels, RENDER still has a solid basing support between $2.50–$2.65, keeping the bullish structure intact unless we lose this zone.
💎Additionally, the chart is showing signs of a potential golden cross formation forming soon, which would further reinforce the bullish momentum and confirm strength ahead.
Paradisers, strive for consistency, not quick profits. Treat the market as a businessman, not as a gambler.
MyCryptoParadise
iFeel the success🌴

RENDERUSD - Ascending TriangleA nice bullish triangle structure this time ascending
Great bull break out situation
I sometimes can mistake ascending triangles for rising wedges but im pretty sure this is an ascending triangle
They look similar!
Weekly timeframe

Render: Running on Empty?Render has climbed nearly 50% since the low in the second week of March but lost notable ground recently. The price remains within our magenta Target Zone between $5.43 and $1.81 and could still dip toward the lower boundary as it works toward completing the turquoise wave 2. Once a sustainable bullish reversal takes hold, we expect a strong rally in the turquoise impulse wave 3, which should target new all-time highs. The resistance at $11.88, which marks the top of the magenta wave from early December, should be surpassed decisively as momentum builds.

RENDERUSD4H
Given the strong movement and good momentum of the Render currency and consolidation above the volume average on the 4-hour time frame
We expect further growth from this currency to the specified levels
And with each price drop, there will be a good opportunity to reduce the average price.
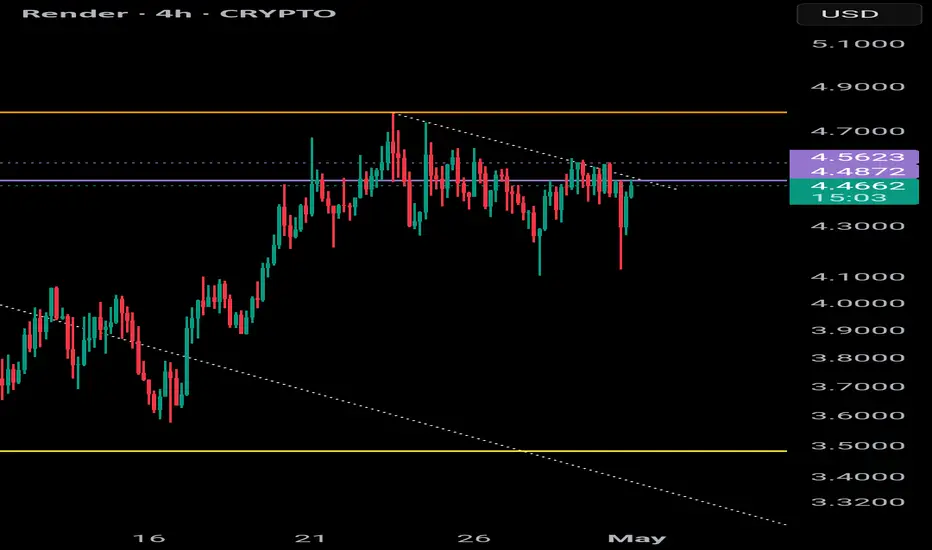
Render (RNDR) Price Breakout: Is a Rally to $5+ on the Horizon?RNDR/USD 4H Chart Analysis – Strong Bullish Breakout Ahead?
Render Token (RNDR) has just broken a key trendline resistance, signaling a potential strong uptrend. Here’s why traders should pay close attention to this breakout.
🔥 Key Insights:
✅ Breakout Confirmation: The price has pushed above a long-term descending trendline, indicating bullish momentum.
✅ Retest & Continuation? A successful hold above the $3.90 - $4.00 zone could confirm the breakout and lead to higher price targets.
✅ Key Targets (Take Profits):
🎯 TP1: $4.47 – First resistance level.
🎯 TP2: $4.83 – Major resistance zone.
🎯 TP3: $5.21 – Strong psychological level.
✅ Moving Average Support: Price is now trading above the MA (3.56), acting as dynamic support.
📈 Trading Outlook:
If RNDR holds above $3.90, buyers could push the price towards the $4.50 - $5.20 range in the coming sessions. A rejection here may lead to a retest around $3.50-$3.60 before another push higher.
🚨 Bullish or Bearish?
This is a strong bullish setup, but confirmation above $4.00 with volume is key for sustained momentum. Keep an eye on Bitcoin and market sentiment!

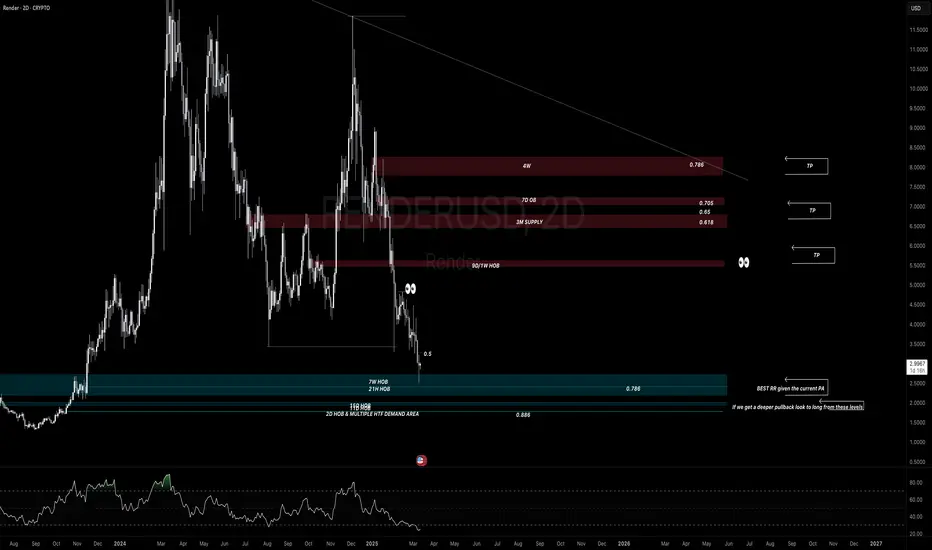
$RENDER has entered my POI after creating a BOSThere’s a significant amount of liquidity between 2 & 2.5, specifically around the 21H HOB, which is located at 2.35–2.4. If that level is reached, it could provide a significant bounce; if it overshoots, we should look at the lower levels as shown in the image. It’s currently bouncing from the 7W HOB, but I’m particularly interested in that 21H HOB.
Let’s see what we get. :)
Render looks intresting!I think we are at the end of correction wave and next impulsive wave is on the way. Divergence is obvious.
R:R at least 5.

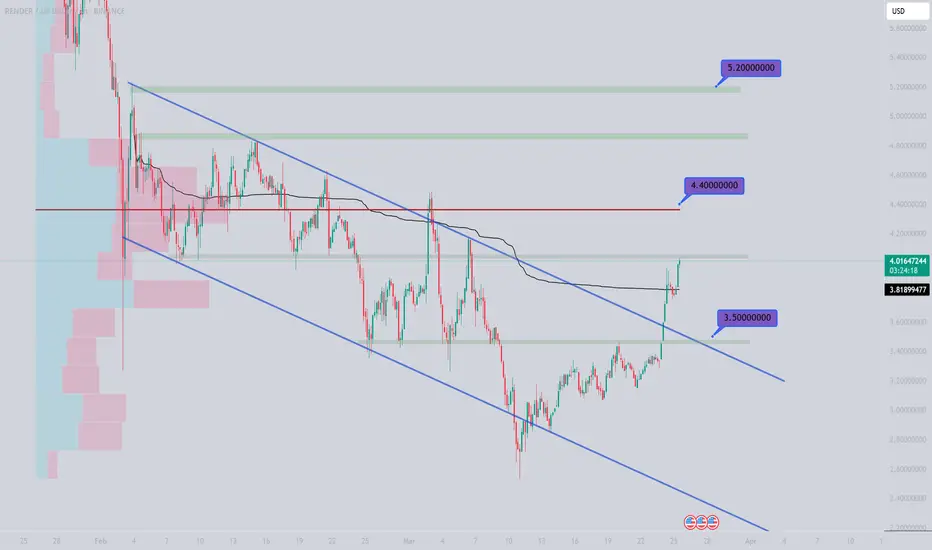
Render about to turn?RenderUSD
Support levels at $4.00 And 3.91
Tight resistance levels at 4.11 and 4.30... if we can break 4.30 this should grind up to the 5.22 levels
I can see render making a rounded bottom here... and start its grind upward...if we break below the 3.92 there is a long way down so as always use cuation and remember that capital preservation is always #1 when trying to make money

Render ; +100$ in playEvening folks , people who know me also know that I’m super bullish on AI , Done some projects before and I’m bullish on Render as well , wanna keep the chart simple and wont say much tho asking you to have your research about render with chatgpt or grok , amazing roadmap and partnerships and amazing community.
Dyor

RENDER reverse head and shoulder Happy New Year EVERYONE! Let's see if this reverse head and shoulder plays out in the next a few weeks.

Render To The UpsideTemporary downside for Render then major move to the upside hitting the 141 after completing triangle pattern. For a price target of around $59

Render: Keep It Up! RENDER dissolved last week’s sideways movement to the upside, with a peak gain of 36%. While part of this advance has been retraced, we primarily expect the upward momentum to continue during the blue wave (iii). After the next high is established, a brief interim correction should occur before the bulls complete the five-wave structure with another upward push.

RENDER LongRender is currently experiencing volatility as it undergoes price discovery. Despite recent fluctuations, the chart continues to align with a long-term upward trend line, indicating sustained bullish momentum. After a recent dip, Render saw a soft bounce but will require significant buying volume to challenge resistance levels. Render appears to be in a favorable position for long-term investment. A continued upward trend is expected, with potential gains likely in October.
Support - $5.16
Resistance - $5.90
RSI - Neutral
Fear & Greed Index (Binance) - Neutral 49 ( as of 10/8/2024)

Render upRender broke the trending, tested supply, holding well the level, take the chance before this goes double digits.

Will ReRender after 100%Render is an AI play.
That statement alone will make this thing see some crazy moves. But technically speaking, it has held up great on support while most other alts pulled back 20-40%+.
Looking at all time highs for this on eventually, in the meantime I want to see it break each major S/R level, and come back to retest it. Creating a nice stair stepping pattern over the course of weeks/months to solidify support and confirm bulls want to stay in this thing no matter the move.
Im not gonna cry if it goes straight up, but ill be much more concerned about a significant pullback if that happens.

RENDERUSD: Key test of 1D MA200. Parabolic rise if broken.Render turned overbought on its 1D technical outlook today (RSI = 72.830, MACD = 0.0820, ADX = 28.717) as it hit the 1D MA200 for the first time since July 2nd. If crossed, we technically expect an aggressive rally to start. The next technical Resistance right above the 1D MA200 is the LH trendline. Last time we had a pattern like that break the 1D MA200 was on October 7th 2023, where both levels broke upwards. Consequently, we turn bullish on Render, expecting again a first bullish wave to the 1.786 Fibonacci extension (TP = 32.000).
## If you like our free content follow our profile to get more daily ideas. ##
## Comments and likes are greatly appreciated. ##

RENDERUSD Bottom accumulation almost over. Don't miss this buy.Render (RENDERUSD) has been consolidating within the 1W MA50 (blue trend-line) and 1W MA100 (green trend-line) for 3 months (since the week of July 29). This is the technical accumulation pattern that the token has gone through on every market bottom (green arc) in the past two years.
The 1W RSI has broken and been trading above its MA trend-line for the past 6 weeks, which is the first bullish sign and an indication that the current accumulation is almost over (similar to previous two bottom formations).
As a result, we expect an aggressive bullish break-out soon, the 3rd major rally towards the 2-year Higher Highs trend-line. Our Target is at least $45.00 (+300% more than the previous one).
-------------------------------------------------------------------------------
** Please LIKE 👍, FOLLOW ✅, SHARE 🙌 and COMMENT ✍ if you enjoy this idea! Also share your ideas and charts in the comments section below! This is best way to keep it relevant, support us, keep the content here free and allow the idea to reach as many people as possible. **
-------------------------------------------------------------------------------
💸💸💸💸💸💸
👇 👇 👇 👇 👇 👇

Bullish SundayGood volume for a Sunday. I'm looking for a break at resistance at $5.85. The chart looks like it will pump once more, with a lower support coming after. After this next break, I'm looking at a $5.20 support. Anyone have input or ideas on where it will go this coming week?

UpdateThe upward trend broke resistance and is currently at $5.67. It may retract below $5.64 in the next couple of days. $5.64 will be my new support line. I'm looking at $5.85 as the next resistance.

RNDR : BULLISH, Despite the Dip - Here's Why👇COINBASE:RENDERUSD
A rare pattern is observed on Render in the daily - a near perfect W Bottom pattern.
Now there are a few rules for a chart pattern to qualify and we're not quite out of the woods yet. The next phase should be a retest of the neckline, where we need to keep CLOSING daily candles ABOVE. A break under this support zone will invalidate the pattern.
From a technical chart analysis perspective; if you trade chart patterns you should be able to successfully take a long on the support zone. All considering, this will be a medium-risk trade:
Another confirmation from technical indicator, the green trendline is a potential wick zone (price on the right pane):
Falling perfectly in the center:
_______________________________
