Is #RENDER Ready for a Reversal or Will it Continue to Fall?Yello, Paradisers! Is this just another range before a full reversal or a sneaky trap waiting to punish early buyers of #RENDER? Let's see the latest analysis of #RENDERUSDT:
💎After several weeks of slowly bleeding within a clean descending channel, #RENDERUSDT is now attempting a breakout from tha

Triangle Breakout Ahead for $RENDERCRYPTOCAP:RENDER is getting ready to break out 🚀
Price has been moving in a tight triangle and is now near the breakout point. It’s holding higher lows and facing key resistance around $3.30.
If #render breaks above this zone, we could see a quick move up.
Entry: $3.22–$3.30
Stop-loss: Below $2.

Render Token Buy Zone: New ATH $17.7, $27 & $46, 2025-26Render Token (RENDERUSDT) is moving within a strong buy zone. Any price below the 5-August 2024 low is a great entry when you aim for the 2025/26 bull market wave. That is, any entry below $3.41 is a very strong, low risk and high potential for reward buy. This is a solid pair.
Remember in 2024 whe

Render (RENDER): Looking For Further Bullish MovementRender coin is still trading in bullish trend where we are aiming to see the price reach as high as $7.00
Despite current weakness in markets, we are still in a bullish channel and as long as we are in it, we are going to look for a bullish move here.
Swallow Academy

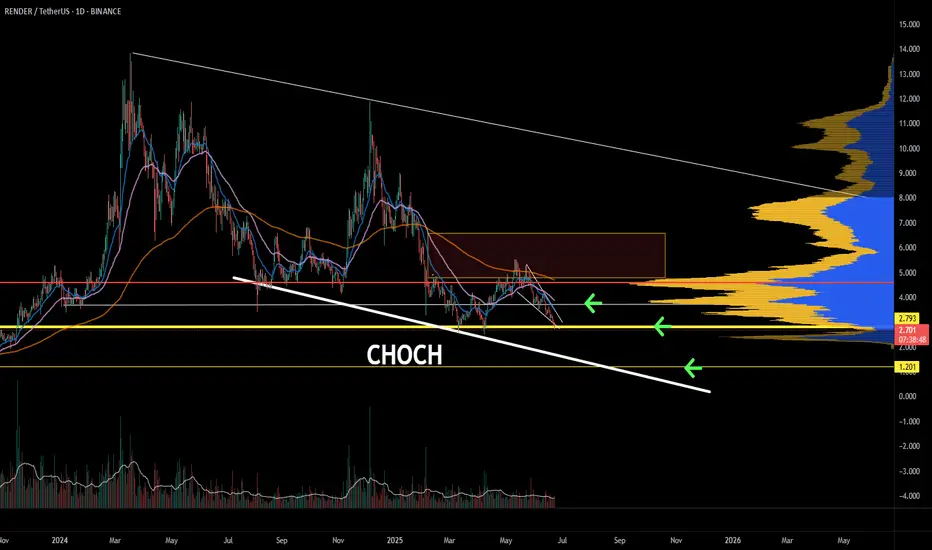
RENDER more downside to come?In this chart I present you RENDER.
1 Week timeframe. I expect that price will go lower, in the 0.29$ area by September (impossible to do timing in the market, but I try to give a month though). After that, we should have the spices for another alt run. In my opinion this will apply for many alts.

RENDERUSDT 1W AnalysisRENDER ~ 1W Analysis
#RENDER Buy gradually from here with a short term target of at least 20%++ from this support block.

Render is at an inflection. Bounce or LL?RENDER technically is still in a downtrend. Given the current events, it is likely that a lower low will confirm the trend continuation. Keep in mind that the price is now oversold. Time to watch for support signals.
Full TA: Link in the BIO
RENDER: Swing Spot Long 16/06/25Trade Direction:
RENDER Swing Spot Long
Risk Management:
- Total risk on spot account approx 0.5%
- Stop loss below most recent swing point will not executed unless daily close below.
Reason for Entry:
- Confirmed daily bullish divergence
- Higher time frame drawn liquidity swept and tapped
- Dail

Render Trade plan RNDR/USDT – Wave 3 Setup in Progress 🚀
This is an Elliott Wave-based setup on the 1D chart for RENDER. Wave 1 and Wave 2 appear to be completed, with Wave 3 yet to unfold. Price is currently sitting near the 50%–61.8% Fibonacci retracement zone ($3.98–$3.63), which is a typical launchpad area for a

RENDER Bounces from Strong Confluence Zone$RENDER/USDT Update
RENDER is holding well above the key support zone after a clean retest of the area of confluence.
What’s interesting here is that the old resistance has now flipped into support, this is often a strong bullish signal on higher timeframes.
Price bounced exactly where you’d expec

See all ideas
Summarizing what the indicators are suggesting.
Oscillators
Neutral
SellBuy
Strong sellStrong buy
Strong sellSellNeutralBuyStrong buy
Oscillators
Neutral
SellBuy
Strong sellStrong buy
Strong sellSellNeutralBuyStrong buy
Summary
Neutral
SellBuy
Strong sellStrong buy
Strong sellSellNeutralBuyStrong buy
Summary
Neutral
SellBuy
Strong sellStrong buy
Strong sellSellNeutralBuyStrong buy
Summary
Neutral
SellBuy
Strong sellStrong buy
Strong sellSellNeutralBuyStrong buy
Moving Averages
Neutral
SellBuy
Strong sellStrong buy
Strong sellSellNeutralBuyStrong buy
Moving Averages
Neutral
SellBuy
Strong sellStrong buy
Strong sellSellNeutralBuyStrong buy
Displays a symbol's price movements over previous years to identify recurring trends.