RENDER price analysisOKX:RENDERUSDT chart is starting to show increased trading volumes.
This could mean that the double bottom is coming to an end.
🟨 Risky - to try to buy #RENDER near $3
🟩 Safe - buy #RENDER after the price is fixed above $4
And then in the range of $6.50-7.50
Which way will you choose?
_____________________
Did you like our analysis? Leave a comment, like, and follow to get more
RENDERUSDT trade ideas

RENDER Descending Triangle 4HBINANCE:RENDERUSDT seems to be forming a descending triangle on the 4H timeframe.
3 clear touches on resistance, and well-defined two-tap horizontal support at $2.50.
Key Levels to Watch 🔑
• $2.50-$2.75 Main support and daily demand zone
• $3.80-$4.20 Daily sell order block (potential resistance)
• $5.00-$5.20 4H sell order block (potential resistance)
Breakout Targets 🎯
⬆️ $5.00
⬇️ $1.50
Still in a No-Trade Zone, wait for confirmation (breakout candle close with good volume).

finally render getting ready for massive bullish wave Render is a solid project with an active and expanding team. When a project shows strong fundamentals and a bullish technical setup, I'm eager to take a trade. Currently, RENDER is trying to break out of a long descending channel consolidation. A successful breakout could lead to a move towards $6."

RENDER ANALYSIS📊 #RENDER Analysis
✅There is a formation of Falling Wedge Pattern on daily chart with a good breakout and currently retests from the major resistance zone🧐
Pattern signals potential bullish movement incoming after a breakout of major resistance zone
👀Current Price: $3.455
🚀 Target Price: $4.4-6.0
⚡️What to do ?
👀Keep an eye on #RENDER price action and volume. We can trade according to the chart and make some profits⚡️⚡️
#RENDER #Cryptocurrency #TechnicalAnalysis #DYOR

RENDERUSDT 1WRENDER ~ 1W Analysis
#RENDER Buy gradually from here with a short -term target of at least 20%++.
RENDER SHORT SETUP ALL trading ideas have entry point + stop loss + take profit + Risk level.
hello Traders, here is the full analysis for this pair, let me know in the comment section below if you have any questions, the entry will be taken only if all rules of the strategies will be satisfied. I suggest you keep this pair on your watchlist and see if the rules of your strategy are satisfied. Please also refer to the Important Risk Notice linked below.
Disclaimer

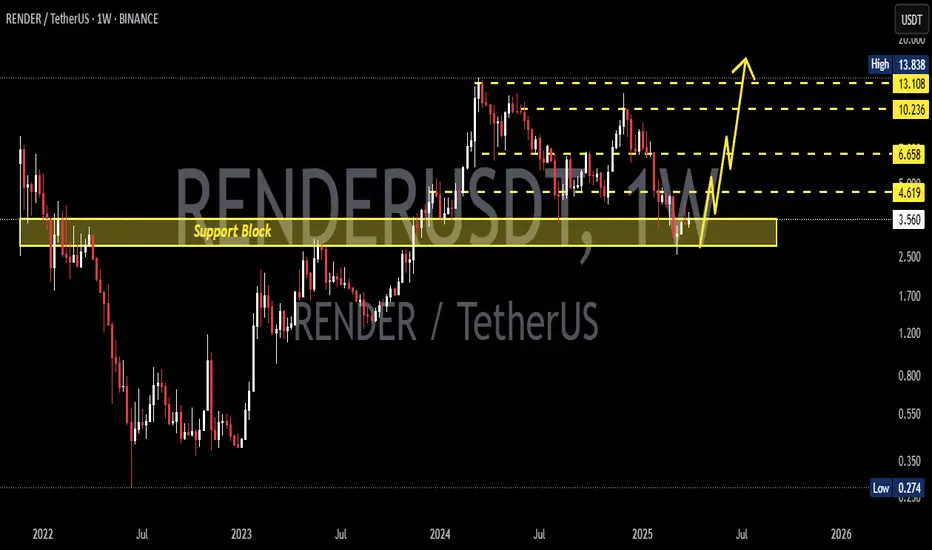
RENDERUSDT 1WRENDER ~ 1W Analysis
#RENDER If you still have a Conviction on this coin. Maybe this support block you can consider to start buying back with a short -term target 20%+.

RENDER/USDT:UPDATEHello friends
Given the good return that the price has had, especially from an important support, it can be understood that the buyers have become strong and we can play behind their hands.
We have specified the buying steps for you and the goals have also been specified.
I hope you like it and support us.
*Trade safely with us*

RENDER: HIGH TIMEFRAME ANALYSISStill the best analysis I've made so far lol.
So basically I just went short due to the following criteria which you can find on the chart itself.

Render/usdtIn my opinion, we can expect growth from this range. The pullback in RSI is complete, so be ready for an explosion!

Render Token Activates Long-Term SupportRender Token (RENDERUSDT) entered the bullish zone in late 2023 when it broke above $3.333. This is mapped on the chart as "long-term support."
Good evening my friend...
Incidentally, this same long-term support level matches MA200 on the weekly timeframe.
This support zone launched the early 2024 bullish cycle and also worked as support in August 2024. In both instances, as soon as this level was activated the market experienced sustained growth.
The same is happening again now, there can be some variations.
Instead of straight up as it happened in the past, there can be some sideways, consolidation/accumulation, before the next rise.
As long as RENDERUSDT trades above this level we can expect growth. This level can be pierced on a wick and the bullish bias and potential remains. If prices move below, a buy opportunity. Cryptocurrency is bullish regardless of the short-term.
The time to buy is now.
Thanks a lot for your continued support.
Remember to do your own research and develop a plan before buying any Altcoin. A preconceived plan can help you eliminate stress and increase positive trading results. A plan can be as simple as knowing if you are ready to hold no matter what happens. If you are ready to hold long-term, your plan can consist in buying each time your favorite pair hits support. Buy and hold. Once the action turns bullish and the market turns green, you will be happy with the results.
One day the market is down and red; the next day everything changes.
Surprise!!! And we are going up.
Namaste.

$RENDERRender Network is the leading provider of decentralized GPU based rendering solutions, revolutionizing the digital creation process. The network connects node operators looking to monetize their idle GPU compute power with artists looking to scale intensive 3D rendering work and applications to the cloud. Through a decentralized peer-to-peer network, the Render Network achieves unprecedented levels of scale, speed, and economic efficiency. On top of a decentralized GPU computing network, Render provides a platform for artists and developers to build services and applications for the emerging digital economy.
RNDR this yearBecause Render is not showing much strength i think its probable that it's just compressing and at some point takes out his range low and high, if it not starts pumping out of nowhere.

RENDERUSDT Below Key Support—But Is a Massive Reversal Incoming?Yello, Paradisers! #RENDERUSDT just broke a critical support level, triggering a major downside move. But here’s where things get interesting—before this drop, RENDER left behind wickless candles at $8.70 to $8.80, signaling unfinished business at higher levels. Could a sharp reversal be on the cards? Let’s break it down.
💎Right now, #RENDER has tested the breakout support region between $3.40 - $3.15—the same level that originally fueled its last major rally. This is a key demand zone where bulls are likely to step in aggressively, triggering short-covering and possibly even a higher time-frame reversal.
💎Sellers need to be extremely cautious here. This zone has the potential to create a slingshot effect, where a sudden surge in buying pressure could trap shorts and send RENDER flying back up before they can react.
💎If bulls successfully defend this level, the first upside target sits at $5.65. A breakout above this could open the door toward $6.25 - $6.55, a pivotal resistance zone that will determine whether RENDER can regain full bullish momentum. Strength above this level would likely send the price surging toward the wickless candle at $8.80, where unfinished liquidity could be swept.
Patience and discipline are key here, Paradisers. The market often tests both bulls and bears before making decisive moves, so stay vigilant.
MyCryptoParadise
iFeel the success🌴

RENDER 1H Sell/ShortHi, dear traders. how are you ? Today we have a viewpoint to Sell/Short the RENDER symbol.
For risk management, please don't forget stop loss and capital management
When we reach the first target, save some profit and then change the stop to entry
Comment if you have any questions
Thank You

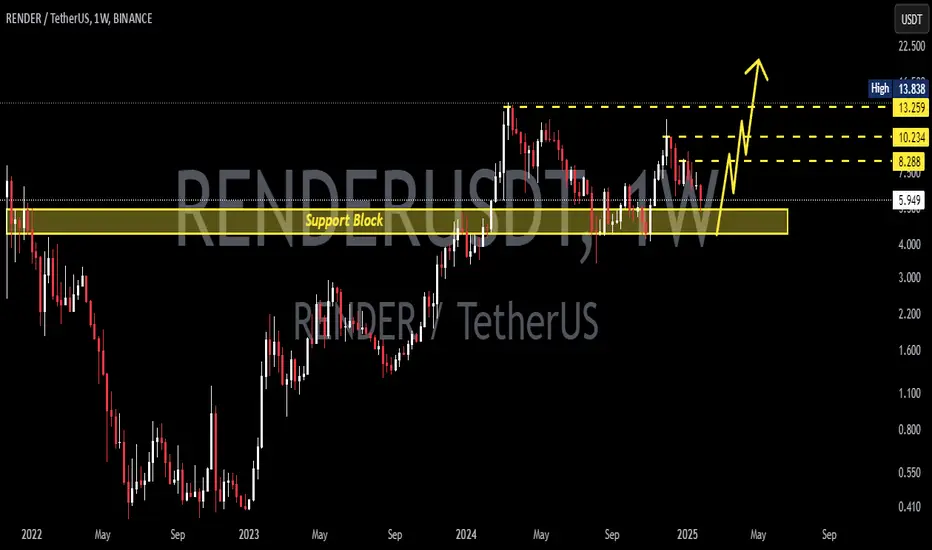
RENDERUSDT 1WRENDER ~ 1W Analysis
#RENDER Re-test this support, Buy from here if you still have a Conviction on this coin with a minimum target of 20%+
Prepare to BUY Spot RENDERUSDT (2025 Growth Pick)🚀 Prepare to BUY Spot RENDERUSDT (2025 Growth Pick)
🌟 RENDERUSDT is positioned for high-growth potential in 2025 – A prime investment for massive returns! 🌟
🌍 Market Overview:
In 2024, several coins achieved x5 - x8 growth, and 2025 is expected to bring new breakout opportunities. RENDERUSDT stands out as a top pick for potential high returns, given its solid fundamentals and increasing adoption in AI & GPU-based computing.
📊 Trade Plan:
📌 Entry Point:
$4.3 - $5.5 or as low as possible – A prime accumulation range.
🎯 Target:
x5 potential return as adoption and demand surge.
⏳ Hold Time:
Throughout 2025, aligning with expected growth cycles.
💡 Note:
Accumulate gradually within the suggested price range.
Monitor macro trends and ecosystem developments to confirm bullish momentum.
Strategic patience will be key to maximizing profits.
🔥 RENDERUSDT is a top pick for 2025 – Secure your position now for massive potential gains! 🔥

RENDER = approaching Entry level!Hi fellow traders, RENDERUSDT is getting ready to make a move higher after it completes the correction. Target the 13.8877 level. Good luck and trade safe!

RENDER UPDATE (1D)RENDER seems to be in a long-term diametric formation.
Wave D also appears to be a diametric.
It is in wave D of D. It could retrace upwards from the green zone.
A daily candle close below the invalidation level will invalidate this analysis.
For risk management, please don't forget stop loss and capital management
Comment if you have any questions
Thank You

RENDER LONGRender is a Narrative AI that is suitable for us to enter Long, by looking at Elliot Wave 1-2-3-4-5-A-B-C, and Price Action where the chart breaks out from the Resistance Trendline and then Retrace.

#render see a figuresmoothly walks inside the triangle, when the upper boundary is broken, we can see a confident exit to the area of 15$

RENDER Bullish Triangle Pattern ?RENDER on 1D timeframe create like triangle pattern on bullish correction
SImple if on timeframe 1W close above $8 we will see bullish continuation, but if we break under $6 maybe say good bye crypto

#RNDR/USDT is testing the Diagonal Trendline in the 4-Hour TF!#RNDR/USDT is testing the Diagonal Trendline in the 4-Hour TF!
🚀 Plan: Wait for a Breakout/Retest above the trendline to open a long position.
🔑 Key Levels:
Support: PWL $6.889
Resistance: PMH $11.85
