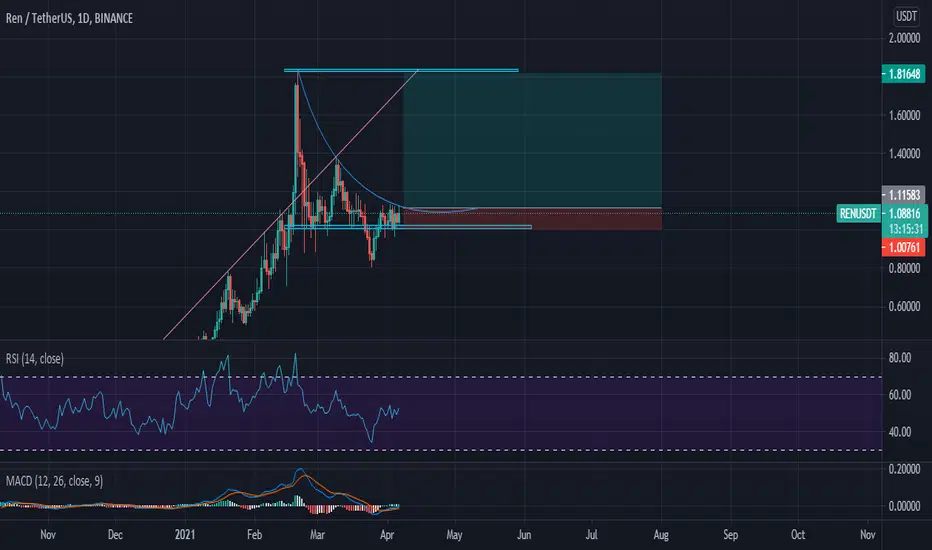
REN is going up the escalator for an extreme Breakout !!!!Hope you like my idea,
This is not Financial Advice, please do your own Analysis,
Stay Happy and Have a Lovely Day.
RENUSDT trade ideas


$REN - Ready for the next leg up.Looks like REN is ready to finish its correction of the impulse from 0.2 to 1.8.
TP1 short-term, TP2 mid-term, TP3 long-term.
Big player with huge potential.
Yesterday partnered with DigiByte & 1INCH.
Considering its nature, the project will continue to announce partnerships.


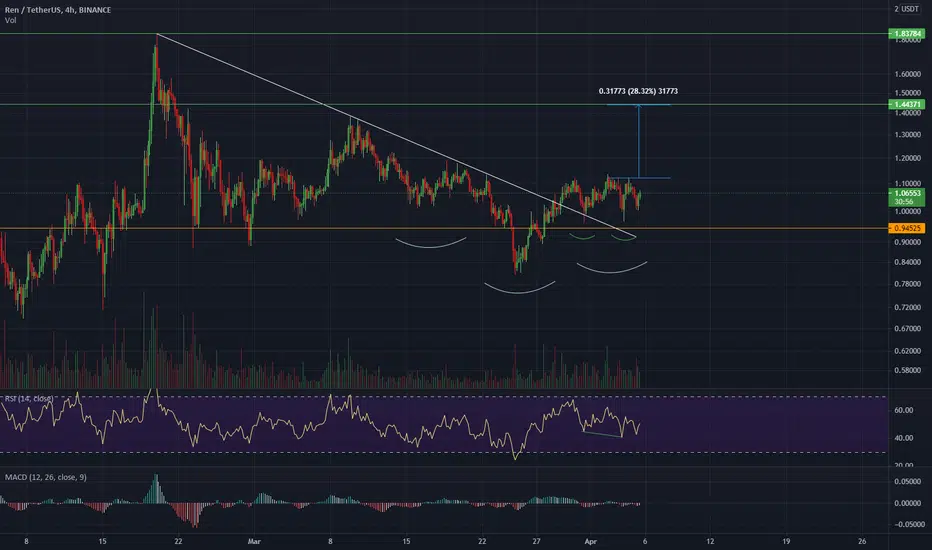
RENUSDT DB confirmation on breakoutRENUSDT broke out diagonal demand line a few days ago.
Break out has been confirmed 2 times now, the RSI is also showing bullish divergence on the 4H and on the 24H macd.
There is an inverse head & shoulder pattern that can take price up to $1.44
Next target would be the 0.786 at $1.61
No financial advice just my view of the markets.

RENUSDT - BREAKOUTREN is going to break out soon.... waiting for a confirmed 4hr close above horizontal resistance and above the descending trendline before we can long this pair.


REN small analysis based on fib. and trend linesRen is struggeling to find solid support. I hope it has found it around 0.90.
Otherwise we could see a bigger dip (which was rejected multiple times in the past
My bet is on a recovery to around 1.10 - 1.15 where there was support in the past & could turn in some heavy resistance for now.
Always keep in mind these are just trendlines no fin. advice. And always keep track on BTC.

RENUSDT to reach for Mars?The video covers my expectations here on Ren.
Concepts used to make my bias:
- Liquidity grab
- Trendline Bounce
- Trendline Breakout


Will Take off very soonI see inverse head and shoulder formation. #ren did not pump nowadays. Now it is the time !!!

REN💎Time Again, My Old REN 🎯REN is an excellent project, and one of the earlier projects to take off on this overall alt run. Feels like forever ago!
Looks like we're almost done with the retracement and ready to swing up for our next leg of the journey. Already breaking out of the downtrend resistance with solid volume behind it.
I'm expecting a very strong movement here with the timing lining up to the current alt push.

RENUSDT (REN) - BULLISH SETUP ANALYSIS 🔎
- RENUSDT hit a swing high and retraced.
- Price is retesting the flip horizontal support (FHS) and the key fibonacci retracement zone (0.5 - 0.618 - 0.786).
- There's a relatively high concentration of buyers at this zone (high buying pressure).
- The retracement was bounded in the falling wedge (FW) pattern.
- The falling wedge pattern is a bullish reversal pattern.
- Price brokeout above the falling wedge's resistance as expected.
- Price action is printing the inversed head and shoulders (IH&S) pattern.
- The inverse head and shoulders pattern is a bullish reversal pattern.
- We could be at the verge of an uptrend continuation.
BUY ENTRY ⬆️
- Conservative entry : breakout above the inverse head and shoulders neckline resistance (NR) / (R1).
- Aggressive entry : market price.
TARGETS
- Horizontal resistance level (R2).
- Horizontal resistance level (R3) / swing high.
- Fibonacci extension levels.
SETUP INVALIDATION ❌
- Breakdown below the right shoulder's horizontal suppor level (S1).

REN - USDT: Strong accumulation zone. Ready to move to 2$REN shows a strong accumulation zone and recently finished its correction wave. Closing a daily candle above the MA50 will be a strong bullish indicator. Long with tight stop loss.

RENUSDTentry: around 1.09
TP1: 1.226
TP2: 1.319
TP3: 1.44
TP4: 1.572
SL: 0.93
Check my website for tutorials, examples and calls :)
cry-pto-surf.com
- My trades are not financial advices
- always use stop-loss
- invest only the amount of money you are ready to lose
- trade with a strict money management method

REN pullback?There are big possibilities we could see some pullback here due to RSI on 4 hour and below already on overbought area. RSI on lower TF also make bearish divergence. Big support around 0.9 cent and 0.8 cent area. This could a great place to long. Daily RSI also trying to make a pullback and on healthy level . We will see some pump if BTC going sideway or dint dump.
But there are possibilities we could go lower due to volatility of BTC . If BTC crash from here, we could see REN will follow to dump.

Inverted head and sholders on REN. BULLISH The inverted head and sholders is an important sign of trend reversal,
Your hit rate is 70%,
In this case, that pattern appears at the end of correction, so bullish!
Take a long position,
Tp at the chart in VPOC zones,
my Stop loss is just a daily candle closes below. It's avoid stop loss hunters

REN/USDT Long 60%As we can see the downtrend that led drawing the curve. On overall on longer time frame we got an uptrend.
A great entry will be on the retest of the breakout of the curve. And take profit targets will be previous resistance levels. I am looking toward 1.4$ and 1.8$