RENUSDT ⚠️ How Low Can Ren Go In This Current Uptrend?Introduction:
💬Ren (RENUSDT) is looking good overall with its current overall uptrend, now the question remains of if this can hold going forward or if this current market structure is producing a top formation?
Only Time will tell but we can surely plan accordingly for both the nest case situation of continuation and worst, being a rollover and breakdown of this current uptrend.
Hit that 👍 button to show support for the content!
Help the community grow by giving us a follow 🐣
Support:
S1: This Bullish Orderblock is being tested ATM and we are hoping to see this be the "best case" scenario for a bottom being found. If that is not the case then we are looking at one level lower to keep us bullish.
S2: We have a Bullish Orderblock and S/R flip contained within this range as shown on the chart. This range is seen as the true bull's last hope going forward, sure we could see that lower range retested but a retest of that would surely break the current uptrend structure and bring a fair amount of fear into the market.
Resistance:
R1: Considering that REN is in price discovery mode we are not looking at any major levels above other than the current range swing high where a Bearish Orderblock has been identified. If we get a break above this level and go higher it is expected that a retest would be a good entry point for a c continuation play.
Summary:
While REN is currently uptrending, we are cautious as this most recent cyclical move shows potential weakness is REN's price structure. Bulls better be planning for the worst and hoping for the best because this could surely get pulled down by the large-caps moving in lockstep with one another if a BTC or ETH correction happens. At the same time though this uptrend would be significantly attractive to anyone looking for a speculative long and so if large-caps make a move higher this one has room to run.
RENUSDT trade ideas

REN/USDT 12hr Chart (Beginner Trader)Nice small pullback after a few days of bullish price action. Hopefully the 12hr candle closes small and the next candle breaks the high of it which will trigger our trade.
If it fits your rules have a look at it.
Any positive feedback would be greatly appreciated cheers.

Ren - supportPossible support area for REN here at .174. Scale buy here, another bite on reversal confirmation.

RENUSDT Looking Like It Will Continue To Set Higher Highs... Ren is still looking bullish... If we can get a break out AND a close above the two tops we could see REN move up another 20ish percent. Ignore my long position graph i only trade FUD and FOMO... jk but i am feeling quite confident REN will continue its bull run and break out to new highs.. Based on the short term decline in price from the top, we may see a bit more of a correct within our ascending wedge before another solid breakout happens.
Ascending Wedge is looking tasty and i'm going to be keeping my eye on the Volume and Momentum indictors for further reassurance.
Let me know what you think. :)

RENUSDTRENUSDT, the has been increasing and about to reach the resistance line. Possible scenarios at this point;
1. It will continue to increase and hit the resistance line above with an open-close candle. it is time to buy.
2. It might start to decrease, wait until it pulls back the uptrend line with an open-close candle, it is time to sell. The next movement will be through the support line.

Binance Hot list coin July, 3rd 2020 : RENUSDT #4The EMA 55 in this chart pattern (yellow) is having a significant effect that drive the price as a dynamic support. In align with this moves, the price is forming a contracting triangle pattern which is now trending very close with the APEX of the triangle. At this stage, there will be a war in the order book between the bears and the bulls. But, it's worth of waiting that in case the price can breaks out to the upside, we'll see a further push toward the interim swing high region.

RENUSDT - GAIN +25% [LONG] 2W25% in 2 weeks.
Keep it going until it goes sideways out of the channel.


Ren ($RENUSD) 🟥 | Why Ren Never Works Out The Way You Plan🟨 Ren's RenVM MainNet is almost here and the bulls are still charging ahead. The upcoming technology is impressive and so is this run.
Let's look at some levels to see the bull's path to glory and the bear's best chance of revenge.
Support:
The S1 S/R flip is the first point of support for the bulls. Finding support here preserves bullish momentum, which is exactly what the bulls want to see.
If S1 can't hold, it likely marks the start of a proper corrective move.
If we do get a corrective move, the S2 orderblock formed at the swing low and the S3 S/R flip at the clear price pivot point should both see reactions as illustrated on the chart.
We would expect any healthy corrective move to find support on the S4 orderblock formed from the move up. If S4 can't hold, then the overall bullish price structure will be lost and REN will need to be reassessed.
Resistance:
The bulls don't have any real resistance to contend with given how hard REN has run. With that said, any support created now stands to work as resistance on the way back up if and when bulls falter. So that is worth keeping in mind for bears and bulls alike.
Summary:
REN has shown real strength, and it is never a bad idea to bet on a crypto that is showing strength. What the bulls want to do here is either keep running, with perhaps a quick touch of S1, or consolidate and then lift off again at S4 or higher. There is lots of room for bulls to keep this going into the MainNet launch, but if price structure is lost things can change quickly and much of the hard-won gains may start to be given up, so make sure to manage risk.
Resources:
www.prnewswire.com
Hit that 👍 button to show support for the content and help us grow 🐣

Long on REN Date: 19th of June 2020
Currecy: RENUSDT
REN as a defi currnecy will have a great uptrend in the coming weeks, the resistance I have given here is based on the structure that REN has demonstrated.
I have used a 4-hour time frame and the Stochastic RSI is heading towards the over bought zone. This is only my analysis to the coin and it is not an advise to buy nor to sell.
I am open to your comments should you have any !!


REN / USDT Yeni Trend Kanalı Oluşuyor.Dün itibarıyla yeni trend kanalı ortaya çıktı. Bu trendin üzerinde kalmaya devam ederse, trend kendini yukarı yönlü geliştirecektir. Aşağı salma yapacağını sanmıyorum.

RENUSDT longWe can see Head and shoulders pattern in downtrend. When the price breaks above the neckline of an inverse pattern it means the prior downtrend is likely over, and an uptrend is underway. It's time to buy. If the price close above 0.1 then we wait for the target #2.
Signals:
MACD line crossing Signal line
Bulish Engulfing 16-18:00 (26.05.)
Broken neckline soon
Please support my work by clicking the LIKE/FOLLOW button.
Always do your own analysis and trust your intuition!
If someone wants advice or private analysis send a PM. I would be grateful to earn some money for you and you send me some donation for my work.


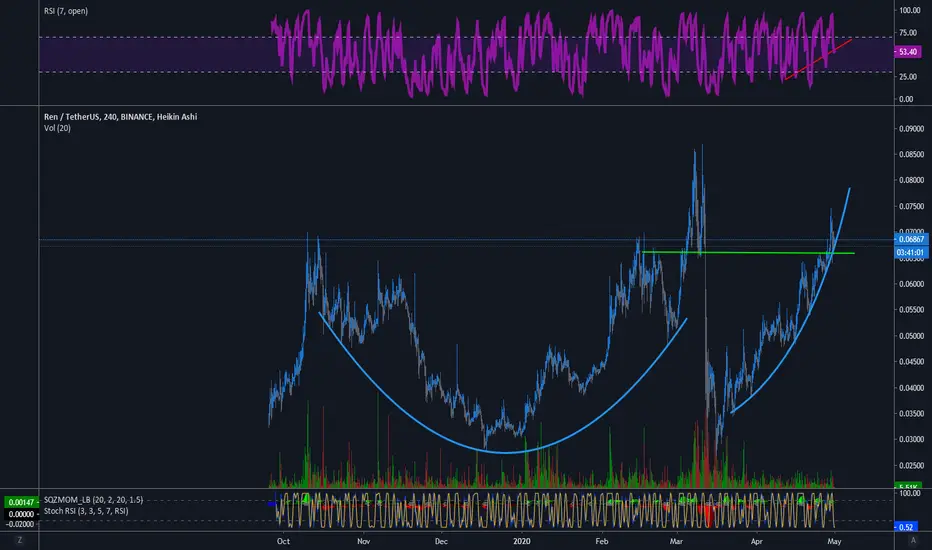
RENUSDT Breakout continuedAs expected, formed a rounded bottom, and price is at all time high.
Once it is done retesting this price point. I would expect it to cool down before entering some sort of price discovery.
If Bitcoin plays nice, this could be an easy 2-3x when it is all said and done.
Previous idea:

REN/USDT (Breakout + New Higher High)REN/USDT
-breakout and new higher high
-new immediate support at 0.071s
-the cross ultimate indicator flashes a Long signal
-trading priority is to the upside
-the potential target is the swing top at 0.0869s+
-key stoploss below immediate support


RENUSDT BreakoutREN just ran through one of the previously significant price point. The neckline from a previous inverted head and shoulder breakout.
With the minimal price history, if the volume follows the breakout this could see all time highs.
REN/USDTProvided one day ago in the New Crypto Package!
Hi Members!
Coin : REN/USDT
Exchange: Binance
SMF strategy would be to Buy :
Entry Zone: Between $0.043 to 0.045
SMF strategy would be to Sell at :
Target 1 : $0.0475 (8%) ---- Achieved
Target 2 : $0.0515 (17%)
Target 3 : $0.0545 (24%)
Target 4 : Raise your personal stop lost
SMF strategy would be to set a stop loss at :
Stop Loss: $ 0.039
Comment : , bounce on the support of the hour. Multiple indicator are bullish.
Proof:


