REPUSD - Resistance Turned SupportWow REP has seen some bearish action.
Could it be time for a reversal? supporting this is the resistance turned support on this large down trend line.
Accompanied by a falling wedge which is a bullish structure.
Reversal?
REPUSD trade ideas


Augur (REPUSD) 2.618 Breakout As you can see price is just moving out of the downtrend circle drawn, providing the point of 2.618
Each time price has touched 1.618 and 2.618 price has lifted, as demonstrated with arrows
Augur is currently listed on the main Ethereum website as a betting site.

Auger (REP) Set Up Primed for Long - 1x - 8x PotentialWe are looking at the result of an impulsive retracement pattern, prepping to execute a possible entry for the long. We must be patient to confirm the 78% level of support is actually support. Additionally, up [on. confirmation we need to monitor the 4H time frame to assess if we get a buying bulling signal/context prior to entering.
THESE ARE ONLY MY CHARTS, NOT FA!!! Trade with proper risk.

Augur Idea - REPBTC/USDREP/BTC can be seen to be forming an obvious falling wedge pattern which has a high success rate of breaking out bullishly
while the USD pair can be seen forming a support above a recent golden cross


Auger (REP) Confirmed Support! Potential 200% - 500% RETURNS?!Thanks again, Aqua Hydro Man for the suggestion!!!
A quick recap on the coin I covered a few weeks ago! WE confirmed the support on the daily timeframes so I actually entered this trade. DISCLAIMER!!! I AM IN ON THIS TRADE!!!! small position but I WILL dump on you at the talked about targets! hahaha This is educational and entertainment not meant to be investment advice. However. 80% of the coins I talk about I do not trade. Just thought id be transparent on the ones I am actually in.

Auger (REP) 3x Potential + Touching supportHey guys, we are touching support after a healthy 61% retracement as well. Looking to on a confirmation. However, if it does not respect support we can go to the 78% zone with major support as our next target loading zone. We have two TP targets the 127% extension and the 361% extension.
GOOD LUCK AND BE SAFE TRADERS!
RR - 1:11


REP looking BULLISH in short term
Judging by these parameters, there is a bit of a buzz around REP today (2/16)
Speaking of prediction markets, PolkaMarket is a HUGE one to look out for. Definitely keeping my ear to the ground for that coin.

A bullish case setting up for Augur (REP). REP/USD
Augur has only 11m in circulating supply.
It's listed on multiple major exchanges
Has very active dev team
I'm a beginning trader and technical analyst. My idea is not trading, investment, or financial advice. It is posted for entertainment. Any constructive criticism or counter analysis is welcome. Thanks for stopping by.
* Of course any precipitous moves by BTC can invalidate analysis.
** Check out the alternative perspective posted below in updated ideas.
KRAKEN:REPUSD
COINBASE:REPUSD

REP possibility to pump?
Defi has been pumping like crazy, REP (a prediction market) might be next, from people FOMO'ing into this after 'missing' the Defi pump.
This is just a theory.
Most people are degenerate gamblers, and REP can supply this need to the whole world. Interesting project.
augur announces new feature updates (update)Augur's prediction market will be supported by L2 automated market making

The only idea I have is to learnNew to the program and look forward to understanding these chart in order to perform technical analysis and identify trends without relying on others.

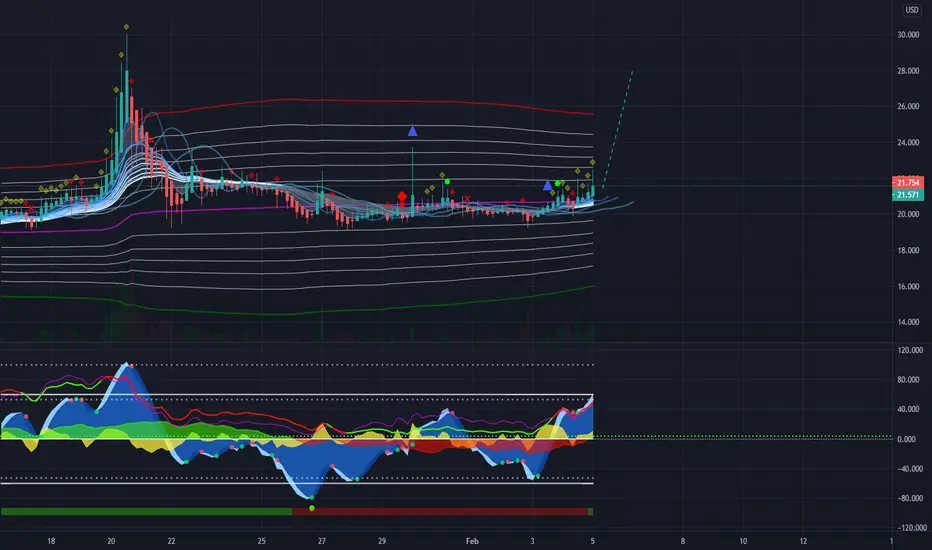
Augur Weekly Gaussian ShiftGaussian channel turning green
This may result in a new ATH for Augur
Post release of V2.

Augur May Continue to Bang For this price analysis, we're going to start on the daily resolution.
We'll also be using Kraken's USD markets as our frame of reference for the price.
Augur Price Analysis
In the chart below, we can see a **strong** underlying diagonal uptrend support that's been carying the price for a weeks (at least):
Multiple Support Point Touches
If we map out all of the 'bounces' that formed the underlying diagonal uptrend support that the $REP price is currently riding on, we should end up counting at least seven touches, altogether on the daily resolution (which is pretty significant):
Recent Explosion in Price Action
While the price action of $REP over the past few weeks (dating back to late March / early April) has been spectacular, it appears that the price has really taken off over the past 24 hours or so.
See below:
Specifically, the OHLC shows us a gain of +22% for the last period alone, which is extraordinary.
Looking For Overhead Resistance Points
Given the situation that we're in (a 'runaway train' asset), our first course of action is to see if we can identify any potential 'momentum stoppers' (i.e., overhead resistance points that we have failed to account for).
To do so, we're going to start with those that we can visibly see on the chart first.
Swapping to the Weekly Resolution
Since Augur's price action has vastly outperformed prior localized 'highs', we're going to swap to the 'weekly resolution' to get a better idea of what long-term, chart based overhead horizontal resistance points may exist (that can serve as potential impediments to the price).
See below:
It actually appears that the price of Augur has broken through the most recent overhead horziontal resistance.
Next Potential Overhead Resistance Point
Staying on the weekly resolution here, the next overhead resistance point (above the one that Augur just shattered), doesn't come into play until the $30 range.
See below:
Librehash Double Guppy Channels
The double guppy channels were created as a means of reconciling the Donchian Channels with the 'CM Guppy' to provide a more helpful, encapsulating gradient channel for the price that would reflexively provide users with a sense of 'expected' price action versus 'extremes'.
Below we have this indicator applied on Augur
What This Means
In short? Impending consolidation.
Whenever the price falls too far to the north / south of the Double Guppy Channels, there is typically a correction (normally the price does not exist too far in the 'red' or 'green' zone without either correcting by moving sideways or performing an outright "reversal").
The two outer edges of the Douple Guppy Channel are re-calculated every period, either widening or narrowing contingent on former price action.
Thus, when the price action (at a given moment) is higher than the highest moving average dictated by the indicator (i.e., the candle has almost 'escaped' the north side / south side of the indicator), that means that the price action is exhibiting behavior that exceeds the indicator's most optimistic scenario (which is **extremely bullish**).
The indicator was tuned so that a performance that extraordinary (bullish or bearish) would indicate impending 'correction' in the market, since extreme conditions rarely persist for too long in a market context.
Taking a Look at Momentum Indicators
At this point, there's nothing else for us to do other than look at other momentum indicators to see if there are **any signs of impending divergence**.
Librehash RSI
See below:
RSI *couldn't be more bullish here*.
Librehash Balance of Power RSI
This indicator *also* could not be more bullish.
Librehash Volatility RSI
The chart above shows the asset's (Augur) volatility *and* price action increasing (more wild moves headed upward).
This Analysis Was Mostly Performed On the Weekly Resolution
It isn't too uncommon for us to see extraordinary indicator readings on the daily resolution (or smaller time frames), but it isn't often that these 'extremes' are witnessed on the *weekly resolution.
We're Already "In"
The price action for this asset is so bullish at this point, that we had to declare our intent to enter into a position *before* the price analysis itself was published at ($24.84; which was already inflated as is).
Our R/R For This Trade:

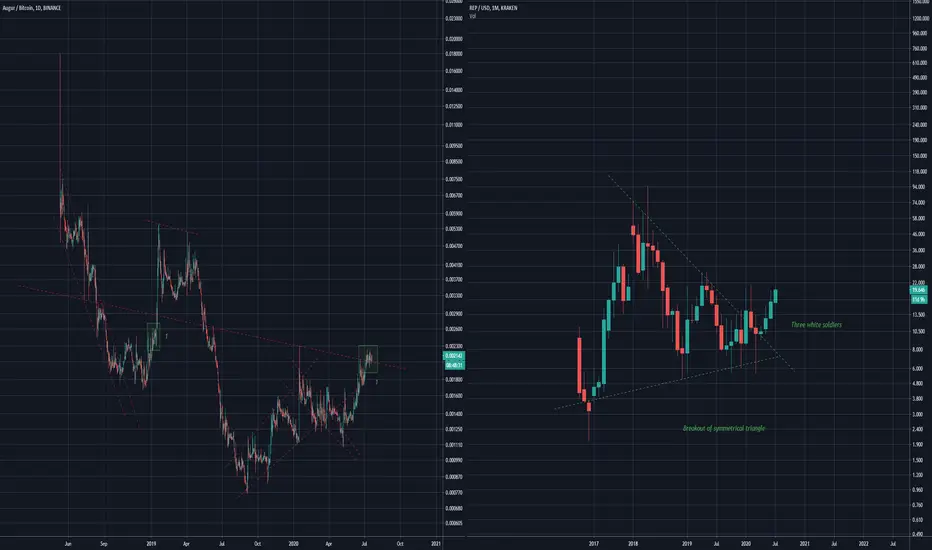
Augur/REP BreakoutA chart for Augur and monthly chart for REP
On augur it can be seen a bull flag is forming comparable to the one seen before a large upward move.
On rep the "three white soldiers" pattern can be observed suggesting a strong transition to a bull market out of the symmetrical triangle.
Unhealthy price action XTZIt can be seen that XTZ is extended way beyond the Gaussian channel on the monthly chart
Meanwhile REP can be seen to be sitting directly in the middle of the channel, which I consider healthy.
This is the monthly chart, momentum may carry XTZ. But I wouldn't be going long.

REP Unseen potentialCrazy potential
If spiral is hit by my wide time range of 2022 to 2024 the price will not be recorded in dollars

Buy the breakREPUSD seems to have broken out of a large weekly symmetrical triangle
also within a broadening ascending wedge

REP ThoughtsThoughts regarding Augur or REPUSD
I believe the symmetrical triangle will follow through with a bullish scenario but this provides a bearish outlook with fib transition mirroring
They release there updated platform soon which i believe will be a catalyst for a bullrun

Ultra BullMassive symmetrical triangle formations, one broken out BSV, the other yet to break out REP.
Consistent higher lows
I know one pair is the BTC pair but i thought a comparison was still necessary.
A scythe is also present
Go long!

Augur BuyBuy on Augur
Included areas for a possible trade
Price must go up or Top cap indicator will go down and break uptrend, which is unlikely.
I am long on this token.
