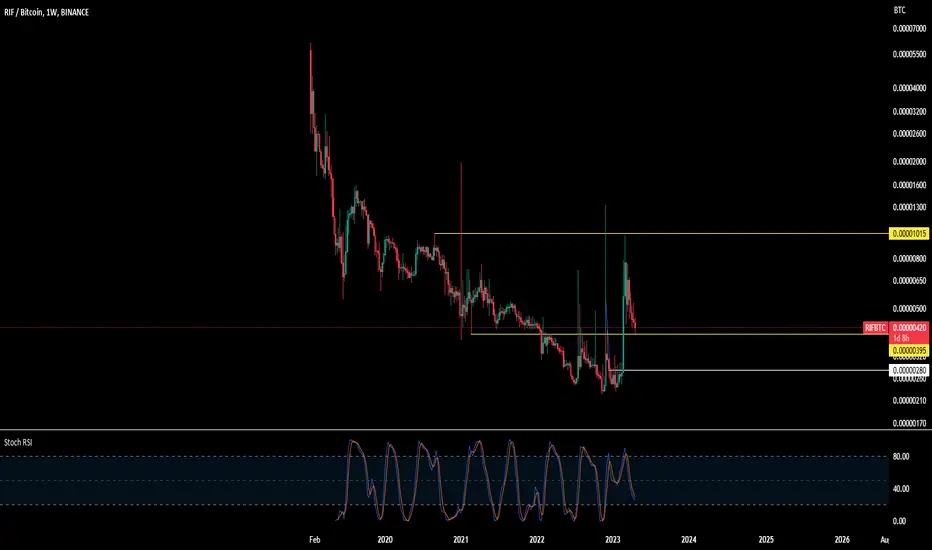
RIF | Keeping It Simple —Buy & Hold (222% BU-Pot.)Let's go straight to the point on this one since I already did a full analysis on the RIFUSDT pair.
Here we can see a major decline, leading to a new all-time low. The bottom becomes flat. As the action flattens, trading volume starts to increase, exponentially.
Because of the all-time low, a reversal would not mean/be a short-term thing. If the reversal is confirmed; expect maximum growth.
On the flip side: If there is another drop, it should be the last one, so the strategy is very, very easy... Buy and hold strong.
If prices drop some more, buy the dip and continue to build your position focusing on the long-term. The lower it goes, the more you can buy. After you are in, there is nothing to do, no action to take, you just wait.
How long to wait?
Wait 3 days, 5 days, 5 weeks or 6 months... It makes no different. The only important factor to take into consideration is the price. It should be higher in 2025 than anything you see in 2024. With that piece of information in mind, you can win now with a simple strategy of buy and hold; it applies to all the altcoins.
Thanks a lot for your continued support.
Namaste.
RIFBTC trade ideas

✳️ RIFBTC | Fast Profits? Part 2 (140% Potential)RIFBTC is now trading above MA200, not only that but today's candle is actually moving higher, which means that this level is now confirmed as conquered, it worked as support.
This implies that the next move is a challenge of resistance; The next major move after the January 2023 bullish wave is now about to take place for this pair.
We have a major long-term higher low:
➖ Main low January 2023.
➖ Higher low October 2023.
Bullish RSI and the ALTSBTC pairs ready to grow really strong.
👉 These pairs tend to move when Bitcoin is trading near a top. When Bitcoin tops or is close to topping, the Altcoins vs Bitcoin (ALTSBTC) pairs move ahead.
This is the market phase we are entering now.
Thank you for reading.
Namaste.

RSK Infrastructure Framework (RIF) | A setup for upto 22.50%Hi friends, hope you are well and welcome to the new trade setup of RSK Infrastructure Framework (RIF).
Recently we caught almost 42% pump of RIF as below:
Now on a 2-hr time frame, RIF with BTC pair has formed a bullish Shark move for a bullish reversal move.
Note: Above idea is for educational purpose only. It is advised to diversify and strictly follow the stop loss, and don't get stuck with trade.

✳️ RIF Strongly Bullish (Name Your Altcoin)RIF produced a major bullish wave in November 2022.
RIF produced another strong wave in March 2023.
RIFBTC has been printing higher lows since Nov. 2022, the bullish bias fully confirmed.
A full correction already took place.
A long consolidation phase already happened as well.
Now, RIFBTC just moved daily above EMA50 and we can clear see a volume breakout supported by a strong RSI.
This pair is set to produce strong growth... Based on the chart.
Make sure to define your own risk and build a plan before taking any action.
This is not financial advice.
Thanks a lot for your support.
Namaste.

#RIF/BTC - Long - Potential 14.50%Direction: Long
Market: Spot
Risk: 0.25% - 1%
#BTC_RIF
Exchange: BINANCE
Timeframe: 360
TP1: 0.00000545
Entry: 0.00000474
STOP: 0.00000403
Entry Conditions:
| Falling wedge breakout
| Resistance flipped to support

$RIF- 140%after its nice pump has retraced and tagged range low now resuming up journey back to yellow line or approx 140% from here
worth hopping on already did some shopping last night thinking save the reserve ammo but tempted with this since it likes ripping
stop below yellow target yellow
RSK Infrastructure Framework (RIF) formed Gartley upto 25% pumpHi friends, hope you are well and welcome to the new trade setup of RSK Infrastructure Framework (RIF).
Our last successful trade of RIF was as below:
Now on daily time frame RIF has formed a bullish Gartley move for another price reversal.
Note: Above idea is for educational purpose only. It is advised to diversify and strictly follow the stop loss, and don't get stuck with trade

Strong Shakeout/StopLoss-Hunt Reveals The Bottom - RSKThis is the pattern that reveals the bottom for the Altcoins (Altcoins vs Bitcoin).
We are looking at it on the RSK Infrastructure Framework (RIFBTC) chart but it is present/showing up everywhere.
This pattern is what we call a "shakeout" or a stop-loss hunt move.
The market breaks down strong below support just to move quickly back above it.
This started happening 24-Jan. and 7 days later all loses have been recovered and instead of consolidation/sideways we will see a new uptrend form.
Another detail about this pattern is the bullish divergence that always shows up long-term.
If you zoomout, you can see the higher low on the MACD and the lower low on RIFBTC.
Keep this pattern in mind when looking for new trading opportunities.
I really hope it helps.
Namaste.

RIF/BTC-1D-BINANCEThis is not a financial advice. Always do your own research and always put stoploss in your trade (SL) :) If you want more detailed info
how to study and read charts or just need help with some coin, just write to me here a comment, i will try to answer to everybody...
i can help you :) all for free, don't worry, BE HAPPY!

rif/btc 1d updateWelcome to quick update ,everyone
Open long rif/btc
Entry: CMP
Target: 10% to 15%
Stop loss:- 0.00000460
This is not a piece of financial advice. All investment made by me is under my own risk and I am held responsible for my own profit and losses. So, do your own research before investing in this trade.
happy trading...
thank you...

RIF/BTC { RSK INFRASTRUCTURE FRAMEWORK } - BULLISH SETUPANALYSIS 🔎
- RIF/BTC is printing an ascending triangle pattern.
- This is a bullish build up pattern.
- There's a breakout potential.
BUY ENTRY ⬆️
- Market entry: current market price.
- Stop limit entry: breakout above the ascending triangle's horizontal resistance (@0.00000521)
- Limit entry: test of the ascending triangle's inclined support.
TARGETS 🎯
- Fibonacci extension levels.
SETUP INVALIDATION ❌
- Breakdown below the ascending triangle's inclined support.


$RIF LOOKING TO BREAK 600 SATOSHI $RIF looking to move along the channel past 600 satoshi. Already tested upper resistance.

Fatality🔥Can't believe that you still want more, wolves🔥
Okay
Here is your new idea
Symmetrical triangle on RIFBTC.
Previous slight bullish trend may be a signal for bullish movement. However don't rush, wait for the clear breakout.
Follow the chart and look for the best price to enter carefully.
_____________________________________________________
If you enjoy my FREE Technical Analysis , support the idea with a big LIKE👍 and don't forget to SUBSCRIBE my channel, you won't miss anything!
Feel free to leave comments✉️
And always remember: "we don't predict, we react".

Great triangle⚖️One more triangle for Friday morning, wolves🔥
Look carefully, smells like money is much closer than you think.
There is a symmetrical triangle on RIFBTC crypto pair.
There was a strong bearish sentiment before but now the price is in consolidation.
That's why wait for the clear breakout.
Follow the chart and look for the best price to enter carefully.
If you enjoy my FREE Technical Analysis , support the idea with a big LIKE👍 and don't forget to SUBSCRIBE my channel, you won't miss anything!
Feel free to leave comments✉️
And always remember: "we don't predict, we react".

RIFBTC is creating a descending channel 🦐RIFBTC is creating a descending channel. IF the price will have a breakout upward, According to Plancton's strategy (check our Academy), we can set a nice order
–––––
Follow the Shrimp 🦐
Keep in mind.
🟣 Purple structure -> Monthly structure.
🔴 Red structure -> Weekly structure.
🔵 Blue structure -> Daily structure.
🟡 Yellow structure -> 4h structure.
⚫️ Black structure -> <4h structure.
Here is the Plancton0618 technical analysis, please comment below if you have any question.
The ENTRY in the market will be taken only if the condition of the Plancton0618 strategy will trigger.
