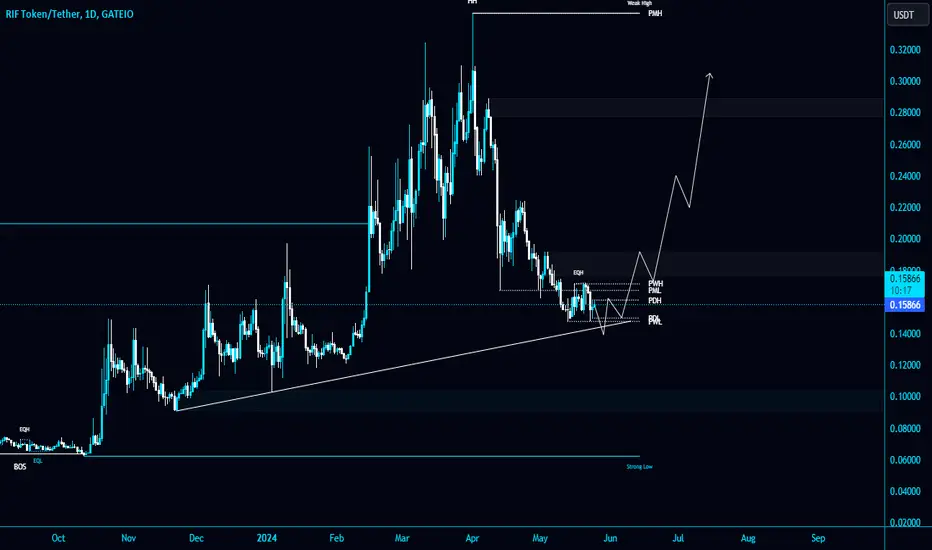
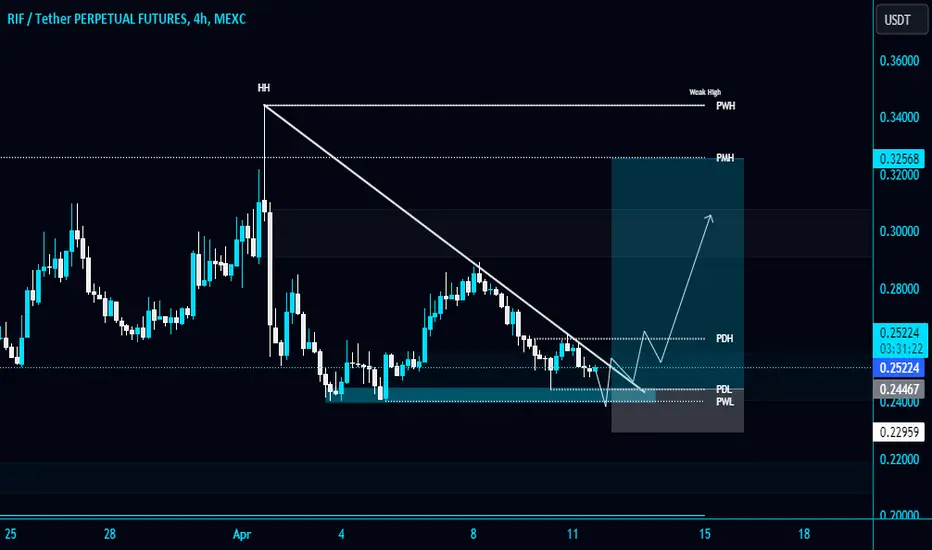
Potential Bullish Breakout in RIF Coin: Eyeing Next Resistance Description:
RIFUSDT is exhibiting a promising setup with a potential bullish breakout on the horizon. If the coin successfully breaks through the current resistance level, it could pave the way for a substantial upward movement towards the next key resistance target.
Key Features of the Setup:
Current Resistance Level: RIF Coin is currently testing a significant resistance level. A breakout above this level would indicate strong bullish momentum.
Potential Risks:
False Breakout: Breakouts can sometimes fail, leading to a quick reversal. It's essential to watch for confirmation of the breakout with sustained volume and price action above the resistance level.
Volume and Momentum: Look for an increase in trading volume as the price approaches the resistance. Higher volume during a breakout confirms the strength of the move.
Next Resistance Target: Upon breaking the current resistance, the next target is the subsequent resistance level. This target is typically identified by previous price action highs or other technical indicators such as Fibonacci retracement levels.
Support Levels: Post-breakout, the former resistance level will act as a new support. Monitoring this support is crucial for managing trades and identifying potential pullbacks.
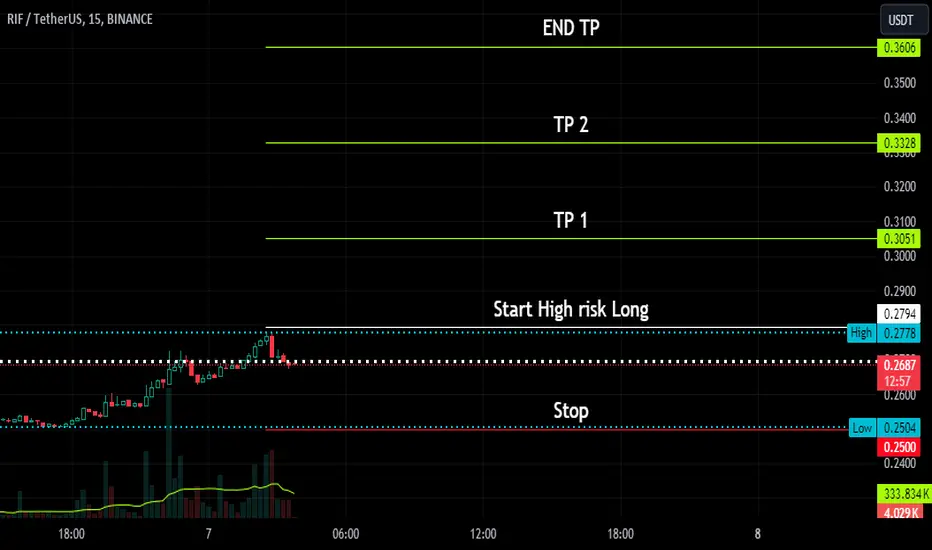
Trading Strategy:
Entry Point: Enter a long position slightly above the breakout level to confirm the move.
Stop Loss: Set a stop loss just below the new support level (former resistance) to mitigate risk.
Take Profit: Target the next resistance level for taking profit. Consider scaling out of the position in stages as the price approaches this target to secure gains.
RIFUSDT trade ideas

RIFUSDTThis cryptocurrency moves within the ascending channel between support and resistance. By approaching the support level of 0.1633 Tether as a pullback and becoming a minor level, we expect the target to move to 0.1711.

#RIF/USDT is trying to hold PWL $0.1472 as support in Daily TF!#RIF/USDT is trying to hold PWL $0.1472 as support in Daily TF!
I'm expecting a retest of the Diagonal Trendline before a bullish momentum. Wait for a successful retest to add some SEED_ALEXDRAYM_SHORTINTEREST2:RIF in Spot too.
#RIF/USDT#RIF
The price is moving in a 12-hour bearish channel, is very committed to it, and has just broken through it
We have a green support area at 0.1400 that is expected to be bounced from due to its strength
We have a trend to hold above the Moving Average 100, which is strong support for the rise
We have very strong oversold resistance on the RSI indicator to support the rise with a strong downtrend
Entry price is 0.1600
The first goal is 0.1950
The second target is 0.2200
The third target is 0.2500

RIFUSD 1WRIF ~ 1W
#RIF We will place small purchases here in stages. it looks like this is a very strong support block. short term target of at least 20%

RIF/USDT Gearing up for an Exponential Rally? 👀🚀RIF Analysis💎Paradisers, stay on high alert! #RIFUSDT is shaping up for a compelling opportunity as it prepares to retest ascending support, indicating a robust bullish move ahead.
💎We've noticed that #RootstockInfrastructureFramework has been consistently respecting an ascending support line on the 1D timeframe, hinting at a solid base for bullish potential. It's now nearing the crucial support level at $0.185.
💎If it holds steady, there's a strong likelihood that it will target the significant resistance at $0.324, with the RSI suggesting a potential upward move, reinforcing this bullish outlook.
💎However, if #RIF loses momentum and breaks below this key support, be ready for a bullish rebound from a lower Demand Zone at $0.135. A drop below this level could signal a considerable downward trend for $RIF. Keep your strategies adaptable and stay sharp for any market fluctuations.

#RIF/USDT is heading towards an important support zone in 4-Hour#RIF/USDT is heading towards an important support zone in 4-Hour TF!
I am expecting a bullish momentum after retest and bounce. Wait for Trendline breakout and retest to Long $RIF.
The major support level is PWL $0.2407. The major resistance level is PMH $0.3265 and PWH $0344.
Long Trade Position RIFUSDTHi my friends. From now on, you can improve your analytical skills with the targets that I will give you and test your patience and strategy to reach price targets in the demo panel with virtual money. These exercises make you experience profit and loss with targets and stops, virtually in the real market and improve your analysis and personal strategy. Know your fear and greed and gradually control them so that your business is profitable and less harmful. I wish you happiness and wealth.
Rif/Usdt Plan RIF/USDT's price is currently consolidating under a triangle pattern, indicating a potential breakout in the near future. A successful breakout from this pattern could lead to a significant bullish move of around 25-50%. However, it is crucial to conduct your own research (DYOR) before making any financial decisions. This statement is not to be considered as financial advice.

#RIF/USDT#RIF
The price is moving in a bearish channel on a 4-hour frame and we have a support area in green at the 0.200 level.
Now we have a breakout that is about to occur well after bouncing from the green zone
Our RSI indicator has a trend that is about to break to the upside
Entry price is 0.2355
The first target is 02570
The second target is 0.2733
Third goal 02930

RIF Growth Spurt: Buy Your Ticket to Profit!
RIF Coin: The Basics
RIF (Rootstock Infrastructure Framework) is the token that powers the RSK Infrastructure Framework, a platform that provides various blockchain-based services on top of Bitcoin.
Here's a quick rundown:
Purpose: RIF facilitates building decentralized applications (dApps) on the Bitcoin network. It offers services like payments, identity management, and oracles.
Current Price: ~$0.07 (as of April 2, 2024)
Circulating Supply: 1 billion RIF tokens
Recent News
RIF price has seen a slight increase (+4.38%) in the last 24 hours.
No major news headlines about RIF itself, but you can check out RIF On Chain: for updates on their stablecoin project (USDRIF).
Disclaimer
Investing in cryptocurrency involves significant risk. This is not financial advice. Please do your own research before making any investment decisions.

RIFUSDTHM signal v3.1 (High momentum) spotted. Looking good with previous wave up with increasing volume and momentum.
- Heathy retracement and support well at good level @ 0.2707-0.2806
- Trending slow and steady if able to hold above the support zone
It is at extremely good reward to risk level now if able to hold above the support level.

RIFUSDT.1DBased on the provided market data, the RIF currency is currently trading at $0.26 against USDT. The RSI (Relative Strength Index) values for 4 hours, 1 day, and 7 days are 73.56, 74.29, and 78.80 respectively which indicates that the currency is currently in an overbought condition. Overbought typically means that a pullback in price could be due.
The MACD (Moving Average Convergence Divergence) values for 4 hours, 1 day, and 7 days are 0.010, 0.020, and 0.030 respectively. The positive MACD indicates that the currency is on an uptrend, which is a bullish sign.
The Bollinger Bands for 4 hours, 1 day, and 7 days are 0.2693, 0.2670, and 0.2717 respectively. The price is currently above the middle band in all three time frames, suggesting a bullish trend.
The support levels are at $0.2270, $0.2011, and $0.1776 for 4 hours, $0.2105, $0.1705, and $0.1240 for 1 day, and $0.1423, $0.092, and $0.062 for 7 days. These levels might be the potential bouncing points for the currency if it starts to pull back.
The resistance levels are at $0.2858, $0.2890, and $0.3275 for 4 hours, $0.3211, $0.3246, and $0.3560 for 1 day, and $0.3070, $0.3658, and $0.4970 for 7 days. These are the levels to watch if the currency continues its uptrend.
In conclusion, the RIF is showing signs of a bullish trend. However, the high RSI values suggest that it could be due for a pullback soon. Therefore, it's important to keep an eye on the support and resistance levels for potential buying or selling opportunities. As always, please consider your risk tolerance and investment goals before making any decisions.

RIFUSDT SetupHere is another set of free signals with technical analysis. If you compare the charts of BTC and BRC20 on a 1D timeframe, you will see that BRC-20 is poised to break the resistance. It appears that this week will favor BRC20. So let's dive in with a strategic approach. Always trade according to your wallet size. Ensure that you maintain 50% USDT/USDC in your wallet to capitalize on trades when price fluctuations occur.
Everything is sufficiently clear in the chart. Take profits when you are satisfied, but remember that "hodl" is gold, and always consider taking partial profits.
Best of luck to all traders, regardless of gender.


RIFUSDT $1.00 Soon!RIFUSDT Technical analysis update
RIFUSDT price has increased by 45% since breaking above the trend resistance line. Currently, the price is testing and exceeding a resistance zone with high volume and trading above both the 100 and 200 EMAs. While these technical indicators could suggest potential further upward movement.
Long term Target: $1.00
Stop Loss: $0.17
Regards
Hexa

#RIF#RIF
The price is moving in a bull flag and is about to breakout
Supported by the breakout of the Moving Average 100 and bullish momentum
Current price 0.1632
First target 0.1775
Second goal 0.1946
Third goal 0.2172

RIF short hello Traders, here is the full analysis for this pair, let me know in the comment section below if you have any questions, the entry will be taken only if all rules of the strategies will be satisfied. I suggest you keep this pair on your watchlist and see if the rules of your strategy are satisfied. Please also refer to the Important Risk Notice linked below.

RIFUSDT 240m longRIFUSDT cryptocurrency pair has recently displayed notable price levels, indicating a potential upward trend. Identifying key support and resistance zones, my analysis suggests a favorable opportunity for a bullish move. I anticipate profit targets at specific price levels, highlighting potential gains, while also defining clear stop-loss areas to manage risks effectively. This concise approach aims to provide readers with a straightforward and actionable trade idea, emphasizing the significant support and resistance levels that contribute to the prediction.

RIFUSDT Daily tf Range Updated till 10-01-24RIFUSDT Daily timeframe range. this is kind of tricky price action. broke out of 0.1614 which is holding out for now. not much of holdup till 0.2204 but need more retail interest on that. if market sentiment cool downs a bit it may get its chance.

RIF/USDTLet's see...
....................................................................................................................
We are not registered or licensed in any jurisdiction whatsoever to provide investing advice or anything of an advisory or consultancy nature.
and are therefore are unqualified to give investment recommendations.
Always do your own research and consult with a licensed investment professional before investing.
This communication is never to be used as the basis of making investment decisions, and it is for entertainment purposes only.

RIFUSDTBINANCE:RIFUSDT Short idea
❌ Note that this is not my stop loss and I use dynamic stop loss.
⛔"Daily crypto market analyses I provide are personal opinions & not financial advice. Trading carries risks, so do your own research & seek advisor's help. #DYOR
Don't forget to 🚀 and comment

rifWe stood for the second time at 2990₽ and we can’t go higher.
The patterns of the golden cross and triangles have already been fully worked out, the moving averages are tightening up, there is a local maximum zone again, what next?
On the short-term chart, the asset has almost completely completed the symmetrical triangle pattern, approaching the local resistance level (previous highs), and the rollback from this level is also within normal limits.
I expect a rollback to 2800~2850₽, then go through the local maximum and resistance zone 3 times (I see it at the level of 3017.5₽).
By the end of the year there is a great chance to reach 3100 rubles, and the prospect of growth up to 3300 rubles
