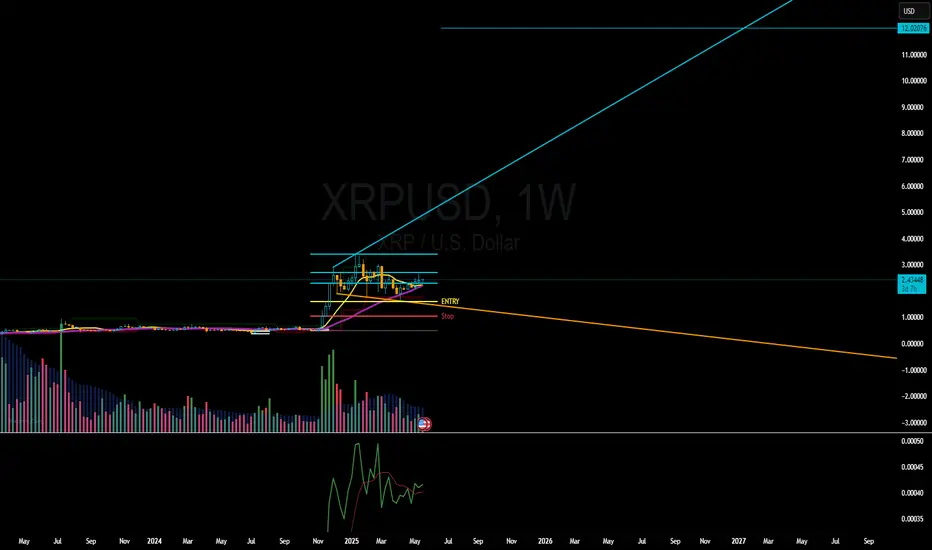
$XRP Few Understand .All that frustration you fell is orchestration. Price before Laws or Laws before Price. It doesn't matter. Its happening .
12$+ by end of June
RIPPLE trade ideas
XRP (Ripple) is at a Critical Supply Zone: Will it Fall or Rise?FenzoFx—Ripple (XRP) is testing the resistance level, which expands from $2.40 to $2.46, with the Stochastic Oscillator hinting at an overbought market.
A new bearish wave could emerge if the resistance holds. In this scenario, the price could dip toward the 50.0% Fibonacci retracement level at $2.37, backed by the 50-SMA.
The bearish outlook should be invalidated if XRP/USD exceeds and stabilizes above $2.46.
Trade XRP/USD with low spread, no commission and no swap at FenzoFx.

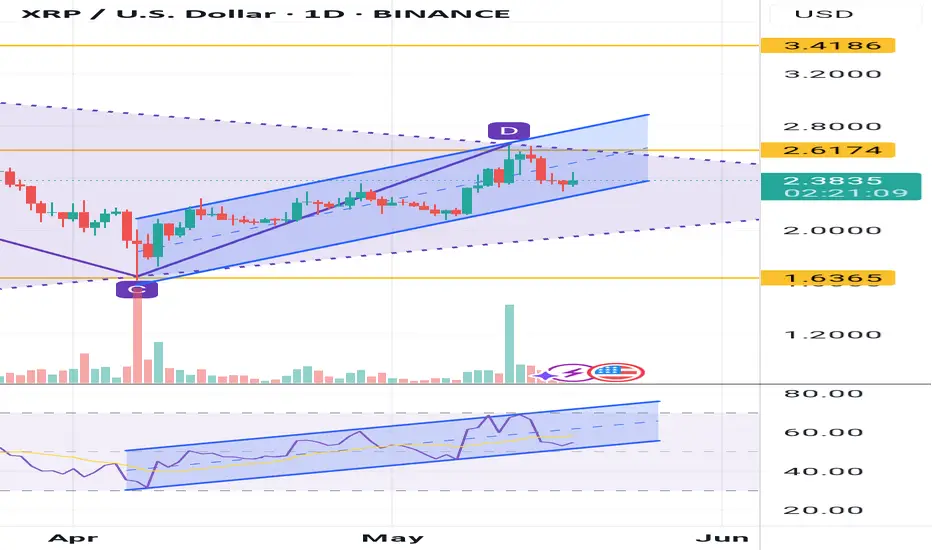
XRP - JUST A FUN IDEAGood Morning,
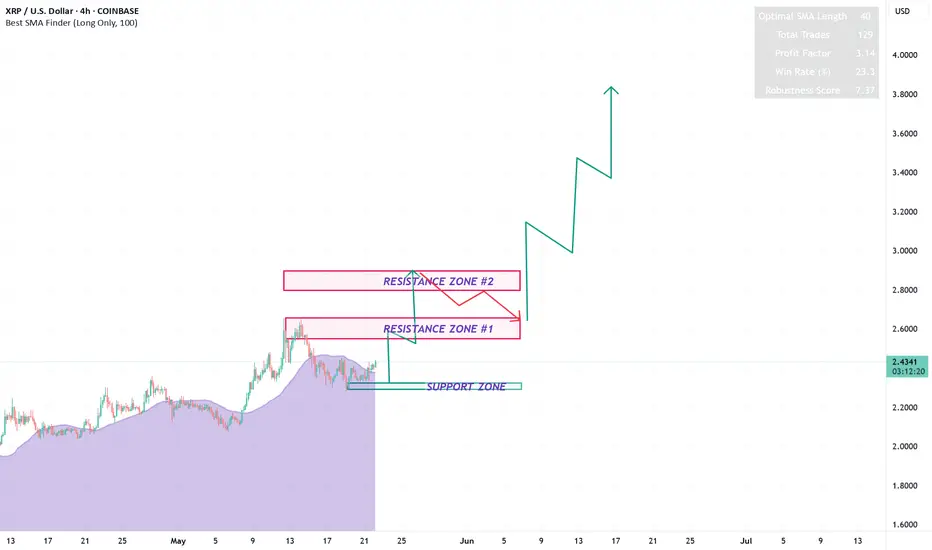
Hope all is well. Although I do not believe in predicting the future (At least not long term), I thought it would be fun to evaluate XRP. If, if I was to take into account support and resistance zones, elliott wave theory, price movement levels this is most likely how it would turn out. As you can see XRP is about to finish a large bullish wave which started April, 07, 2025.
We have just experienced a pull-back in which I believe will lead to one more bullish movement upwards before correcting again into a slightly larger pull-back. After this move if we maintain all previous supports it would be highly likely that we hit the 4$ mark.
Buckle up lets see.
Thanks
XRPUSD Bull Flag broken. Can it go x10 from here?XRPUSD has broken above its Bull Flag, which has been the corrective pattern of the Trade War since January's High.
At the same time a 1day Golden Cross is being formed and if we get the same rally that was followed after the recent U.S. elections, the price may hit the 2.0 Fibonacci extension.
This represents a bold x10 move from here with a $23 target. Do you think that's plausible for this Cycle?
Follow us, like the idea and leave a comment below!!

Trandline format inXRPUSD trade with safeXRP future make trade line and make lower low, lower high formation, if the price break trand line upper or lower side than you have a good chance to catch the momentum

XRP's road to $18$18 XRP before end of year
Potential backtest of $2.10 - $2.19 before moving into price discovery.
Underperformance target: $8-13
Overperformance target: $31-40

XRPUSD Just Hit a Major Wall—Is a Breakdown Imminent?XRPUSD is trading around $2.34, and it's bumping into heavy supply near $2.58—a zone where price previously reversed with force. This chart is screaming caution for late bulls.
What’s Happening?
$2.58 Supply Zone – Strong institutional sell zone. Price got sharply rejected here after a quick pump.
$2.31 - $2.26 Support Range – If broken, it opens the door to deeper drops.
$1.72 Demand Zone – High-volume area and potential bounce zone if the downtrend continues.
Why This Matters: XRP is forming lower highs after a supply zone rejection. If price fails to reclaim and close above $2.58, we could see a strong drop toward $2.15 or even $1.72.
My Game Plan:
Watching for a bearish confirmation below $2.30 to consider short entries.
Will look for buy setups only near the $1.72 demand zone or if price reclaims $2.58 convincingly.
What’s your XRP plan?
Are you loading up or waiting for the dip?
#XRP #Ripple #XRPUSD #CryptoTrading #PriceAction #SupplyAndDemand #FrankFx

Weekly trading plan for XRPIn this idea I marked the important levels for this week and considered a few scenarios of price performance
It seems that the price is in a local triangle and if the descending trend line is broken we can expect growth to the resistance zone
Write a comment with your coins & hit the like button and I will make an analysis for you
The author's opinion may differ from yours,
Consider your risks.
Wish you successful trades ! mura

XRPUSD is moving within the 2.3050 - 2.4400 range👀 Possible scenario:
On May 21, XRP price dropped below the \$2.3350 level but has since started recovering and could soon attempt to break above $2.40.
On May 20, the SEC delayed 21Shares’ XRP ETF filing along with at least three other altcoin ETF applications, despite positive regulatory developments. Analysts remain confident the SEC will eventually approve these ETFs, noting that delays are common due to the slow pace of government processes. Despite setbacks, optimism persists as the SEC typically uses its full review period. Bloomberg analyst James Seyffart expects any early approvals by late June or July, but more likely in the fourth quarter when most deadlines occur.
✅Support and Resistance Levels
Now, the support level is located at 2.3050.
Resistance level is now located at 2.4400 .

Calling It Early — Before the Crypto Gurus Even Notice!XRP/USD is giving us that candle retracement setup that I’ve been waiting on. Based on structure, it’s looking like a clean retest of $2.65 is right around the corner. 🔁📊
I’m not basing this off hype. This is pure chart behavior. The candles are showing strength, and the path is looking like it’ll sweep through this key level before pushing higher toward the previous ATH.
This is bullish momentum, not guesswork. You gotta see it to believe it.
🧠 Remember: Most people react to the news.
Smart traders react to the structure.
No doubt at all—
There can only be ONE... XRP the Standard. ⚖️🚀💥

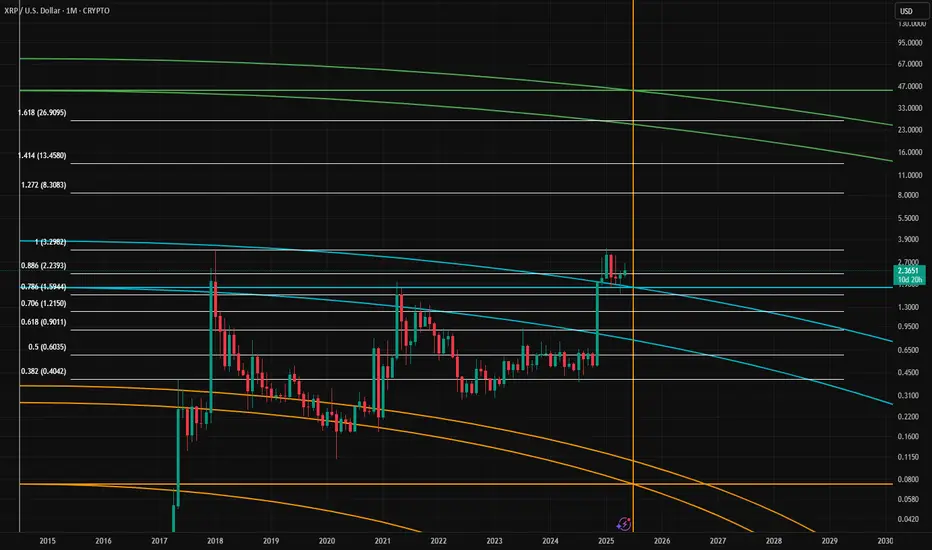
Next levels for XRP!This Gann arc held as support and price will go right to the next arc. I'm seeing a confluence with th 1.618!
XRP flash crash 5/20/2025 - 5/25/2025XRP flash crash, repeated pattern
targets:
$2.19
$2.08
$2.05
$1.97
$1.89
$1.76
ALTCOIN BOOM FOR RIPPLE XRP 2025-2026 PROPOSALThe RLUSD "Trojan Horse" Thesis XRP’s path to $33 hinges on RLUSD becoming the first stablecoin to merge institutional adoption with DeFi utility, creating an inescapable demand loop for XRP. Here’s why this is not just another stablecoin play:
1. RLUSD Is a Liquidity Nuclear Reactor for XRP Unlike Tether (USDT) or Circle (USDC), RLUSD isn’t designed to exist in isolation. Ripple’s patents confirm RLUSD will use XRP as collateral in its liquidity pools (e.g., 80% RLUSD / 20% XRP). This means:
Every 1B of RLUSD adoption requires 250M of XRP buys to collateralize pools (25% ratio). If RLUSD captures just 5% of Tether’s market cap ($112B), it would necessitate 14B in XRP demand – 4x XRP’s current market cap.
This collateral mechanism creates a self-reinforcing cycle: RLUSD adoption → XRP buys → price surge → RLUSD credibility ↑ → adoption ↑.
2. Regulatory Arbitrage: RLUSD as the “KYC Stablecoin” Ripple’s SEC settlement gives RLUSD a first-mover advantage as the only compliant stablecoin for banks. While Tether faces existential regulatory risk, RLUSD is pre-vetted:
Pre-integrated with RippleNet’s 400+ KYC’d institutions, bypassing adoption friction. Designed to comply with the EU’s MiCA and US’s Clarity for Payment Stablecoins Act (2024), making it the sole stablecoin legal in G20 jurisdictions.
Banks will prefer RLUSD over “risky” USDT for cross-border flows, forcing them to hold XRP as collateral. This turns XRP into a shadow reserve currency.
3. CBDC Interoperability: RLUSD as the Bridge Ripple’s CBDC partnerships (20+ governments) plan to use RLUSD as a “neutral layer” between sovereign digital currencies. For example:
A Japanese CBDC user sending to Brazil’s Drex would convert JPY → RLUSD → BRL via XRP-ledger, with RLUSD acting as the sanction-proof intermediary. This would require central banks to hold RLUSD (and thus XRP) as liquidity reserves, akin to IMF’s SDR basket.
No other stablecoin has this government-level pipeline—not even USDC.
4. Killing DeFi’s Liquidity Fragmentation RLUSD is being deployed on both XRPL and Ethereum, but with a twist: Ripple’s AMMs (Automated Market Makers) will prioritize XRP/RLUSD pairs across chains. This:
Forces DeFi protocols to hold XRP to access RLUSD liquidity (e.g., a DEX needs XRP to create RLUSD pools). Redirects stablecoin yield farming demand into XRP staking.
Result: RLUSD becomes the liquidity glue between TradFi and DeFi, with XRP as its backbone.
5. The “SWIFT Killer” Endgame SWIFT processes $40T/year but takes 3–5 days per transaction. Ripple’s RLUSD integration allows real-time FX swaps via XRP:
A French bank sends RLUSD to Mexico → XRP ledger instantly converts RLUSD to MXN at near-zero cost. This disintermediates correspondent banks and saves institutions SEED_TVCODER77_ETHBTCDATA:10B + annually in fees.
For this to work at scale, RLUSD liquidity pools must hold X,XXX,XXX,XXX in XRP – a demand shock no opponent can mathematically counter.

Xrp - Prepare for at least a +50% move!Xrp - CRYPTO:XRPUSD - will head much higher:
(click chart above to see the in depth analysis👆🏻)
Xrp has perfectly been respecting market structure lately and despite the significant volatility, the overall crypto market remains bullish. Especially Xrp is about to perform a bullish break and retest, which - if confirmed by bullish confirmation - could lead to a rally of about +50%.
Levels to watch: $3.0
Keep your long term vision!
Philip (BasicTrading)

XRP/USD – Massive Rejection from Demand Zone! XRP has just bounced perfectly off the demand zone between $2.3124 and $2.3387, forming a potential bullish reversal setup. This zone has been respected previously, and we’re seeing strong signs of buyer interest returning.
Using LuxAlgo’s Supply & Demand tool, we’ve identified clear liquidity blocks overhead. A clean break and retest above $2.38 could open the doors to a push toward $2.4939 and possibly the supply cluster at $2.6031.
Bullish Confirmation Setup:
Reclaim of $2.38 support
Volume spike during push
Bullish candle close above lower resistance
Risk Management Idea:
SL below $2.3120 | TP1: $2.4939 | TP2: $2.6031
What’s Your XRP Target This Week?
Drop a comment and share your bias—bullish or bearish? Don’t forget to like this idea if it helped shape your strategy!
#XRP #XRPUSD #CryptoAnalysis #Ripple #SupplyAndDemand #LuxAlgo #TechnicalAnalysis #BreakoutTrade #FrankFx14 #CryptoTrading

XRPU Correction continueMy vision where going price next week.
Important area 2.350 if break it down price will fall to 2.160.
If break up 2.440 go back to 2.650.
But for my opinion bearish correction continue.

XRPU correction My vision where going price next wek.
Important area 2.350 if break it down price will fall to 2.250 and lower.

Ripple (XRP) Could Rally If Support HoldsFenzoFx—Ripple (XRP) has extended its downtrend from 2.650 to the key support at 2.30. XRP is currently trading slightly above this level.
The smart money index reads 1.28, matching prior lows where price previously bounced.
Support remains at 2.26. As long as XRP stays above this, a move toward the 2.44 resistance is likely.
Bearish Scenario: A drop below 2.26 would invalidate the bullish outlook, potentially opening the path to 2.06.

Xrp priceIf xrp stays in this daily channel . We must expect xrp break the weekly triangle in the next week . According to my last idea...if xrp breaks this triangle we would see a huge pump . It may rest above 3.68 fib mark which is 14 to 20 dollars.
What is XRP's actual potential? Technically and fundamentally, I see XRP reaching a maximum of $13, which is its technical target given the current range in which it is trading.

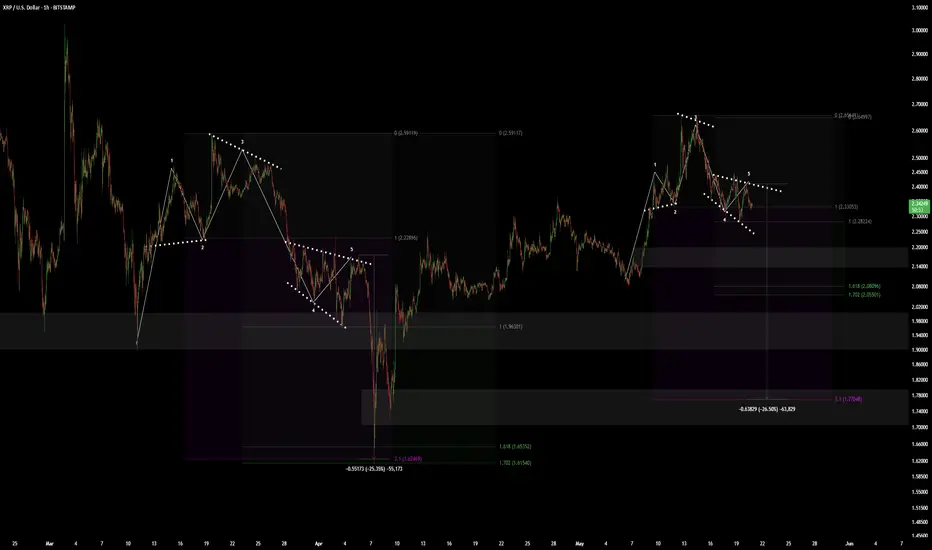
Ripple - what's next?
Ripple. This assumed wave II green may still under way as nothing impulsive of the blue degree has yet formed to convince that wave III.1 green (or 1st blue in the IIId) is underway. XRP possibly (optimistically) can continue going up now (will take a lot to explain), to that upper brown line (imo, channeling techniques), but not to the red one. Timing considerations send to end of July for the start of the next big wave, with the last corrective part (Z) tapping 3d time on the current trendline candidate and printing likely some reversal pattern. XRP is not out of the woods yet, but can go up locally, not more.

XRP at $7 in 50 days!Like the rest of the market XRP has been stalling a bit for the last few days.
The coming 50 days will give us several new ATHs, though.
For this scenario to play out, we need a strong break out from $2.57 and a strong support from $2.60.
Look at the chart and find the minor pullbacks going up to around $7 !
God speed to all of you !

XRPXrp has had a great pump from the bottom ,reclaimed the 200 day and the 20 (in green).went back retested the 200 broke out of its downward channel now currently retesting the 20.. if market conditions stay as they are with no surprise black swan events the ship can get going real soon.
