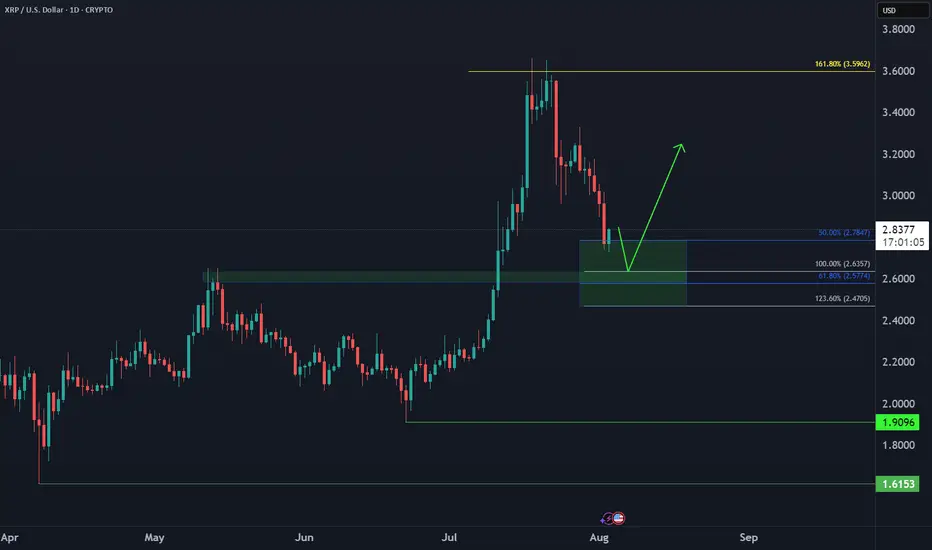
Ripple XRP Bullish Reversal📈 CRYPTO:XRPUSD dropped in 3 swings vs June low, now in buy zone $2.78–$2.47. Marginal lows still possible, but bounce expected next week from this extreme area.
RIPPLE trade ideas
XRPUSD Is Heading Up, The Best Case Above 3.66Possibility for xrpusd as well to go up. As we have complete h4 expanding flat.
The stop could be below the low of the latest low of bullish engilfing candle. The best case we can go all the way up above the high of July 2025, 3.66.
Dont risk more than 1 % for this trade.

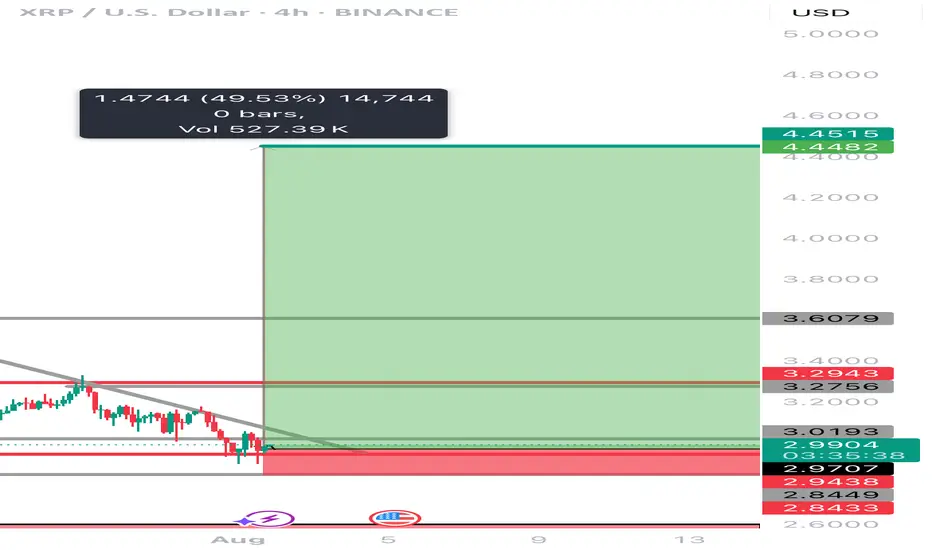
Can XRP obtain a 50% increase in the next few weeks XRP has recently been under a lot of manipulation lately! Is it time for the bulls to finally step in and move the price point on this digital asset to a 50 percent increase to another ATH at $4.45………? The world will see with the next few weeks! And why is #Bradgarlinghouse X account always following 589………..? It’s it a signal or is he just trolling
XRP VS AI ?Hi,
This is fun, come on XRP $4.95
Average Speed (Points/Day) 0.053
Retracement Amount (Points) 0.80
Retracement % 51.28%
Probability of Retracement % 5-10%
Projected Next Move Size (Points) 2.09
Next Projected High Price 4.95
Estimated Duration to Next Target 39.4 days
Projected End Date 2025-09-10
All the best
Not a guru

XRP breaking wedge2 for 2 on here now. IH&S went according to plan. Rested on the daily pivot and now its off on good news for their appeal drop.
Now were breaking out of the falling wedge. Next target is 3.56 supply then 3.74, daily r1 pivot.
Watch inflow for support. Could see some shake downs. Remember, this bad boy, and others like it are ONLY MOVED by institutions. Market Makers. You and me, we don't have the capital to drive them one red cent. So, any real quick move was for a reason. And its not for the sake of retail.
Follow for more bangerz


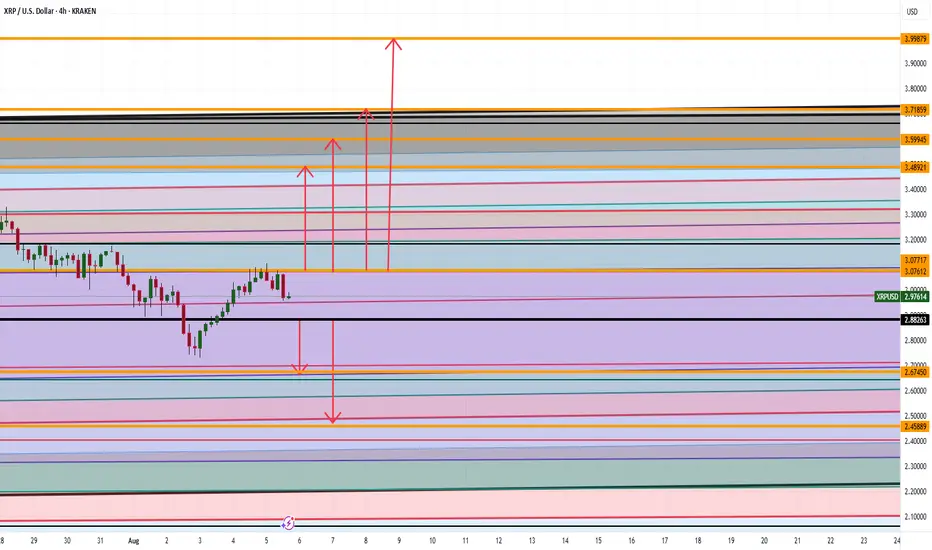
XRP ARE WE GOING TO $4 ANALYSIS Good afternoon
So looking at XRP we can spot a couple things :
Bullish Side: If we can break the high at 3.07 then 3.48,3.59,3.71, and 3.99 makes sense
Bearish Side: If we go below 2.88 then a drop down to 2.67 then 2.45 makes sense
Trade Smarter Live Better
Kris
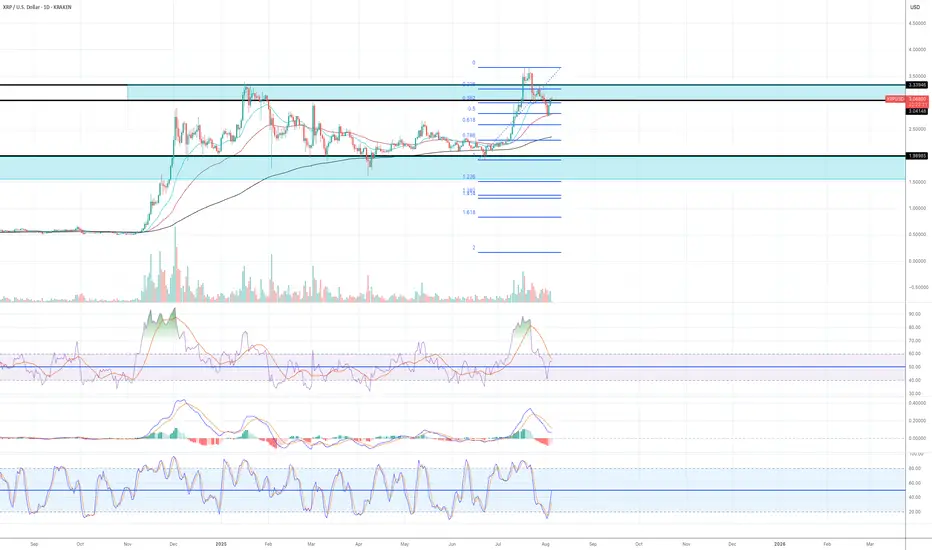
Working to move to the upsideMy views on XRP still hasn't change since my last article. The price action has been quite volatile, but if you look at it in the higher time frames such as monthly/weekly/daily, I think XRP is still working to move to the upside.
Daily:
1) The price has found the temporary support at Fib 0.5 level and EMA55.
2) yesterday's daily candle closed above $3.07 area (previous major resistance area)
3) Both RSI and MACD are still in the bull zone.
4) Stochastic has reached the oversold territory the lines have crossed and now are moving to the upside.
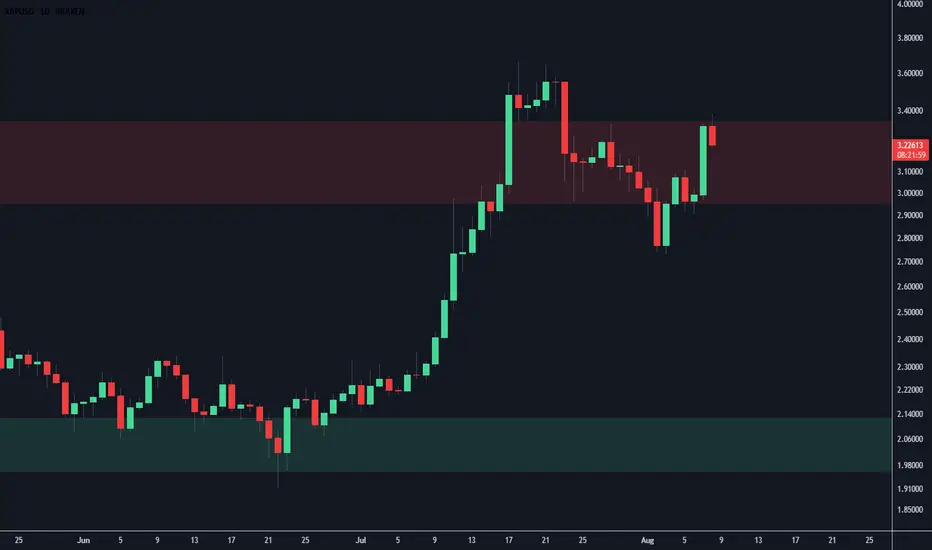
XRP retracement levelsWhere is XRP next likely to head next?
$2.65 is the next price level down with 4 points of contact. This level was also a weekly high as well as the 0.5 fibbonachi.
Next level down is $2.34 with 6 points of contact.
There is a downtrend forming so a breakout of this trend could be bullish for XRP 📈
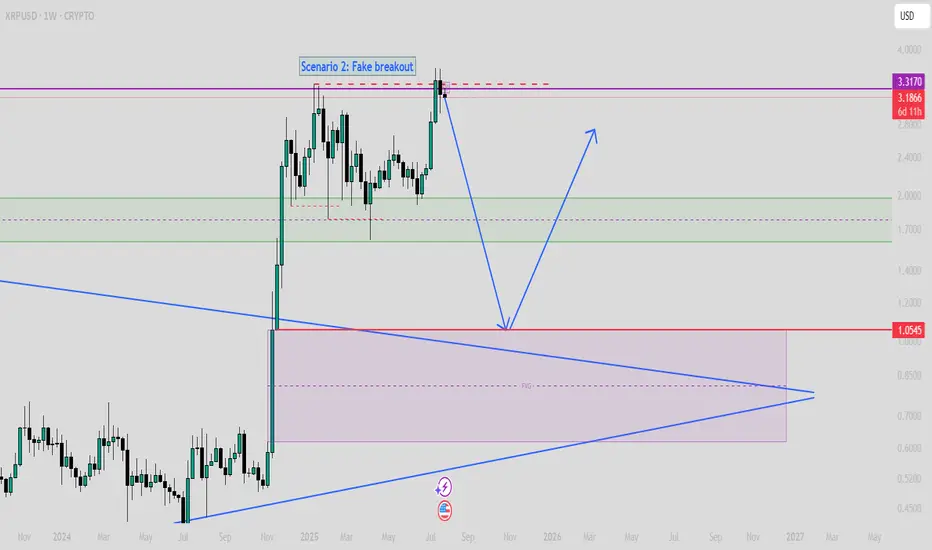
$XRP SCENARIO 2: Fake Breakout (Read caption)If XRP can't close strongly upper than $3.5 on the weekly time frame, then we must consider this scenario!
In this scenario, the first target will be $1.6, and then, based on time, even value around $1 is achievable.
Xrp - The final bullish breakout!💰Xrp ( CRYPTO:XRPUSD ) will create new all time highs:
🔎Analysis summary:
After a consolidation of an incredible seven years, Xrp is finally about to create new all time highs. With this monthly candle of +40%, bulls are totally taking over control, which means that an altcoin season is likely to happen. And the major winner will simply be our lovely coin of Xrp.
📝Levels to watch:
$3.0
🙏🏻#LONGTERMVISION
SwingTraderPhil

XRP/USDNew chart following the spike.
Currently battling at previous 2 week high around the 3.31 mark. I see a retract back to the 3.11 mark with a return to 3.76 region.
If we are lucky enough to reach the 3.57 mark i am planning to do a healthy profit grab with anticipation of a possible quick drop.
This is my second chart. I have enjoyed learning and observing everyone's charts. I am open to any suggestions on how to improve accuracy.
XRP ?
Hi
Don't miss 3-3.05 range
I think it's a value area for now.
Risking 0.05c only
Potential Upside as per previous analysis, AI etc
All the best
Not a guru

XRP/USD Breakout Watch: $3.22 Target in SightA key blue trendline on the XRP/USD chart that reflects market sentiment. If price breaks above it with strong volume, we could see a rally toward $3.22.
Support zone: $0.55–$0.60
Bullish case: Improved sentiment, easing tariffs, and regulatory cooling
Strategy: Wait for breakout confirmation before entering
Share your thoughts — are you preparing for a breakout?

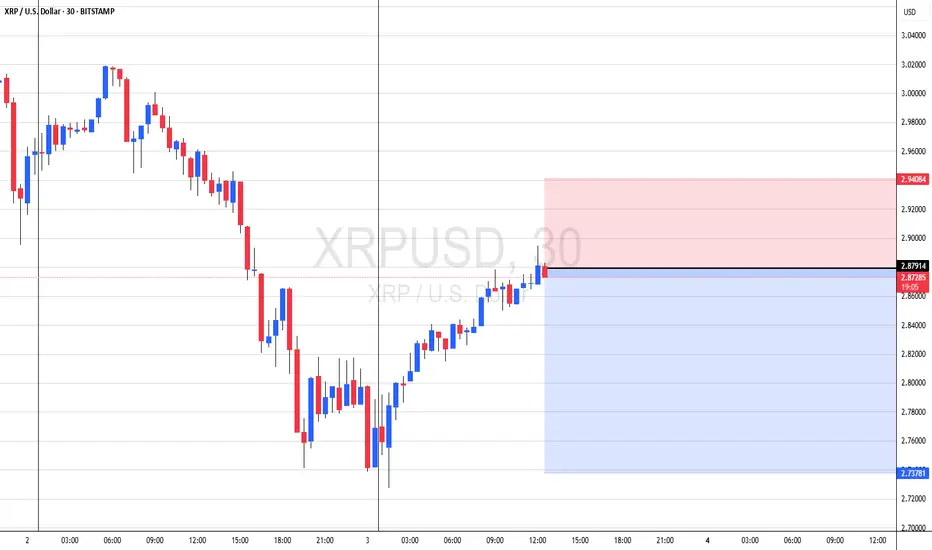
XRPUSD 4 Hour BottomXRP has broken out of the weekly wedge leaving a long weekly candle stick close. Price has pulled back indicating it it ready for the next leg higher. Daily candle closed bullish and 4 hour time from has double bottom.

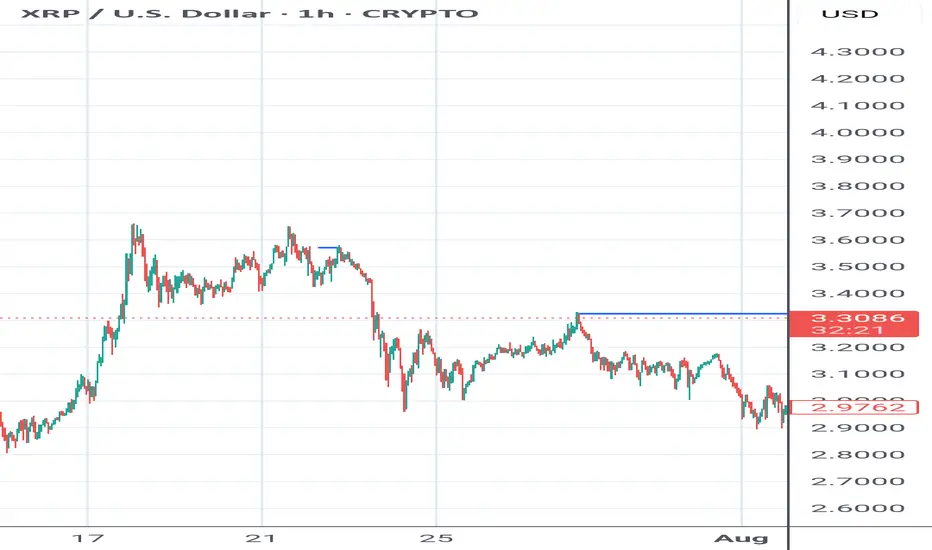
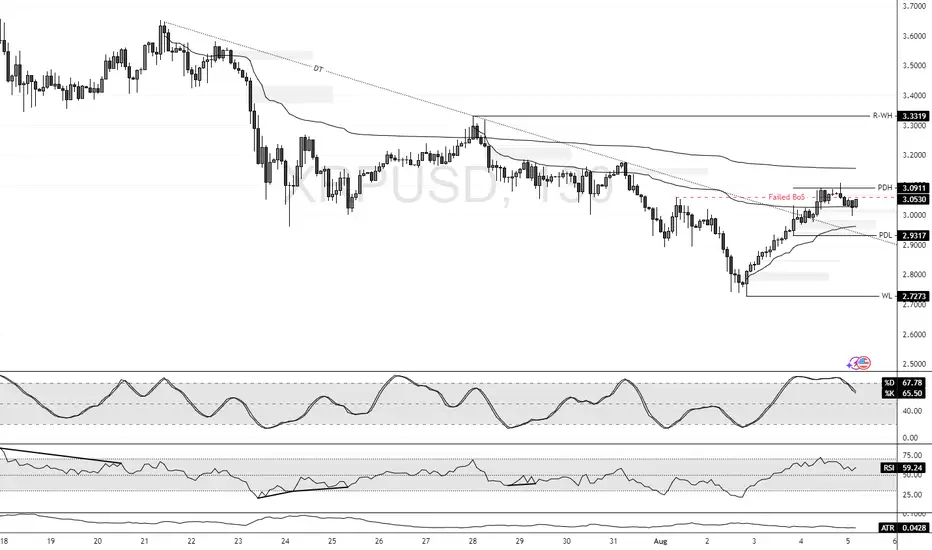
XRP's Failed Structure Break Signals Further ConsolidationFenzoFx—XRP/USD currently trades around $3.045 in a low-momentum market. Stochastic exited the overbought zone and is declining, signaling strengthening bearish momentum. The failed structure break in the New Session suggests a liquidity sweep with weak bullish interest.
Immediate resistance stands at $3.091. Technically, price is expected to decline toward the previous day's low at $2.931, a key liquidity zone. Please note that the bearish outlook is invalidated if price exceeds $3.091.
XRPUSD downside target 2.656On the daily chart, XRPUSD has retreated from its highs, with short-term bears dominating. Currently, the price is in a downward trend, so shorting near the downtrend line resistance is recommended, with a target around 2.656.

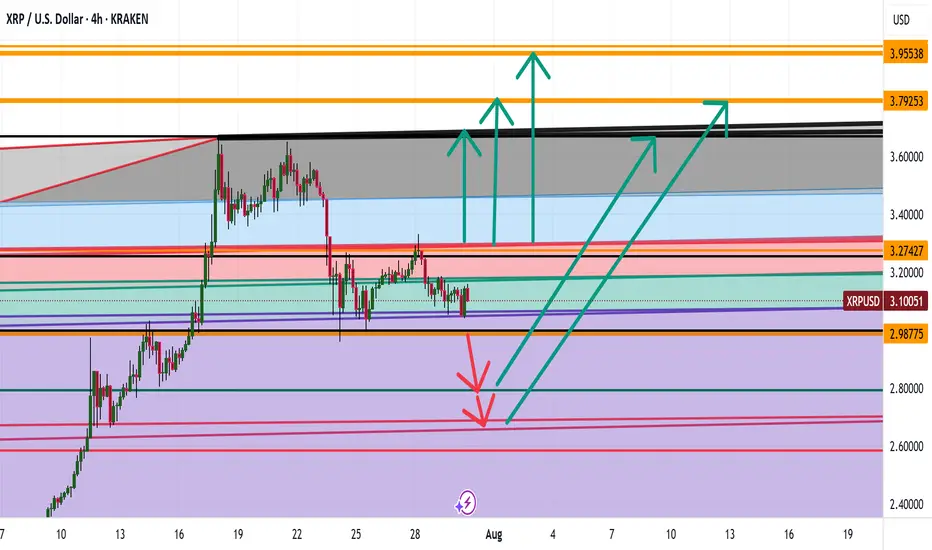
XRP WHERE ARE WE HEADED ? LEVELS TO LOOKOUT FORHey trading fam
So XRP is a fun one but based on BTC correcting and what we are seeing there are a couple thesis's that we currently have for it
Thesis 1: We break south from 2.98 lows: Levels to look out for:
2.80
2.70
2.68
Thesis 2: We break the highs of 3.29: Levels to look out for:
3.65
3.79
3.99
Trade Smarter Live Better
Kris
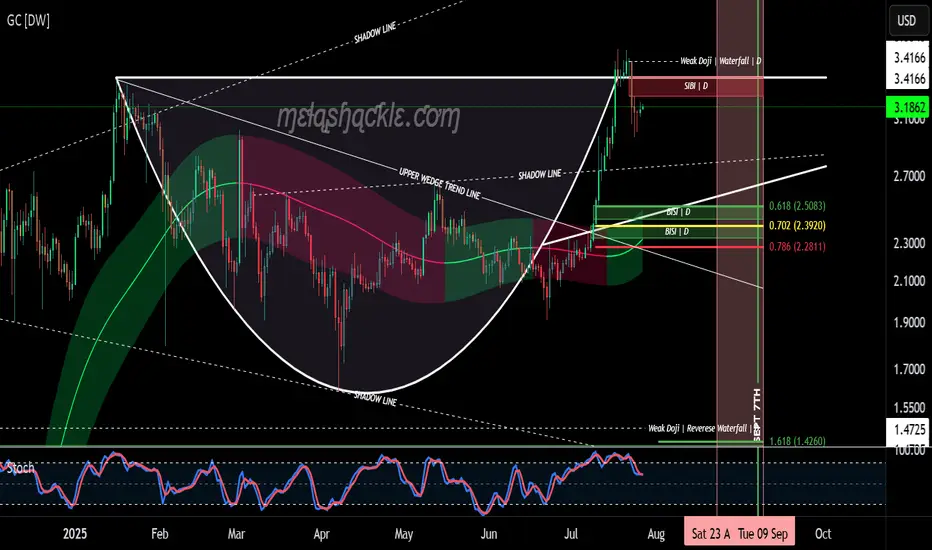
XRP Cup & Handle Pattern on the Daily Chart.XRP is now forming the handle on a very nice cup-and-handle pattern on the daily chart, starting at the previous all-time high set on January 16th, 2025.
But this pattern isn’t all sunshine and rainbows. The price of XRP could drop down into the $2.50 range—toward the bullish fair value gaps I’ve outlined at the bottom of the handle—before making any credible gains or a major breakout to higher levels.
I do believe we’ll see much higher prices in XRP in the coming years as we continue moving into the new global digital financial system. However, for this pattern to fully play out, there will likely be some pain before the pleasure.
I’d keep a close eye on the pink area marked on the charts—spanning from August 23rd through September 8th—as a potential zone for bearish price action.
Luckily for me, my XRP bags have been filled since before the Trump election pump, so I don’t personally need to buy more—unless I see a clear buying opportunity.
Good luck, everyone!
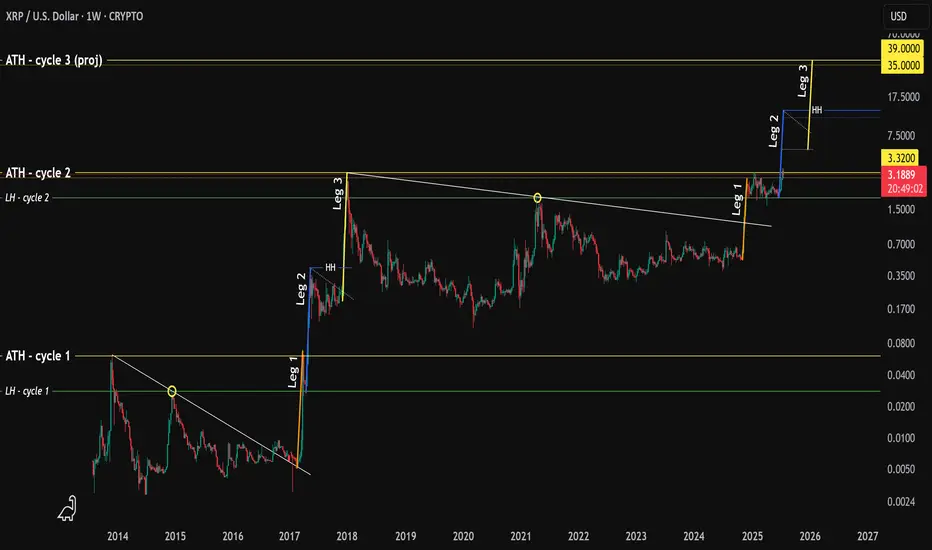
XRP - history repeating?Hello.
I'm going to walk you through what happened in the early years of XRP p.a. and how this fractal might play out today.
Here's what happened.
1. A high was printed in 2013 (ATH)
2. Followed by a lower high (LH)
3. XRP broke out of a downtrend 📈
4. In 2017 price increased 1,280% finding resistance @ ATH (we'll call this "Leg 1")
5. The LH then acted as support, followed by sideways price movement
6. Price increased 1,460% creating a higher-high (or "HH") which surpassed the ATH and this is "Leg 2"
7. Again, sideways price movement.
8. An increase of 1,560% creating a new ATH Dec 2017 - "Leg 3"
What's interesting here is that each leg takes 5 weeks to play out (that's 5 green weekly candles to put a finer point on it).
Fast forward in time - what do we see?
A high..
A lower high....
A breakout of the downtrend..
Followed by..... you guessed it... 5 green weekly candles
Hold on...
A rejection at the ATH
The LH acting as support...
With sideways movement .. 👀
The symmetry is quite profound and provides us with an idea of what will happen next.
If we consider the move in Nov 2024 as "Leg 1" then one could argue that "Leg 2" is currently in play.
Leg 1 was not as significant as the uplift we saw in 2017 (480% vs 1,280%)
However, if we assume that the variance between Leg 1 and Leg 2 rhymes then the projected uplift from the LH would be 550%.. making XRP price roughly $11-13
It follows that price will then move sideways/consolidate/capitulate for several months.
Followed by one last move to the upside which, using the variance between Leg 2 and Leg 3 put the final leg @ 585% or $35-39.
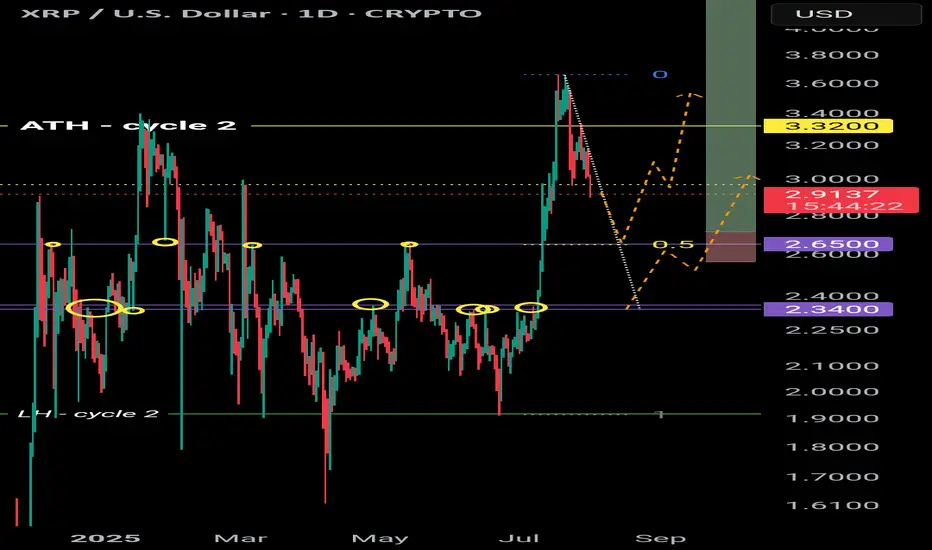
Wild guess but based on historical Bitcoin halving peaks and XRP ATH in both cycle 1 and 2 landed at the back end of Q4, it is assumed the same could happen (put simply: the end of 2025).
You're welcome.
XRPUSD Long, short, longWhole market is manipulated every minute... My prediction can be wrong but I see things this way right now ... Would be grateful for you to share your point of view ...
