RIPPLE trade ideas

Adjusted Fibonacci Sequence due to the higher priceAdjusted Fibonacci Sequence due to the higher price
All else is as is I'm buying lower did not chase this candle sold it $2.32 I believe that that was the top of $2.38 it caused the Divergence and now the price reverses once it hits the 50% line I'm going to sell my xrp 3s short and by long $7,777 which is 50% of my Holdings and by lower if necessary

XRP Approaches Critical Support at $2.00Key Technical Level:
XRP is testing the strong $2.00 support level, which has consistently acted as a key price floor since December.
Descending Triangle Formation:
The price action is forming a descending triangle, where decreasing volatility suggests an imminent breakout. This pattern emerges as XRP approaches the intersection of descending resistance and horizontal support.
Bullish or Bearish?
A confirmed breakout above resistance could trigger a strong rally.
A sustained drop below $2.00 would invalidate the bullish outlook, potentially leading to a retracement toward $1.60-$1.80.
Market Perspective:
XRP’s rally from $0.60 to over $3.40 since November suggests that the current correction is likely a phase of profit-taking rather than a full trend reversal. However, traders should remain cautious and watch for confirmation of direction.
Stay alert—XRP is at a decisive moment! 🚀📉
#XRP #Crypto #MarketAnalysis #Trading #TechnicalAnalysis #Cryptocurrency #Bullish #SupportLevel

Updated Fibonacci sequence to the bar on xrpUpdated Fibonacci sequence to the bar on xrp.
Prior post States at all however my bylines were incorrect I took the Fibonacci sequence on the blue bar to get the lines to put my buy-ins on they were incorrect on the prior chart I want to update that for you now

For those that follow xrp on my behalfFor those that follow xrp on my behalf
I had already posted that at around $2.32 I would sell all I have actually been buying and selling throughout the candle going up I would make a cell line by lower sell it higher by lower sell it higher I have been doing that all the way to the top now you're going to see 50% lines of my total going in on those bylines 50% on each of those lines and then all of it at the bottom line if it goes that far when a price reaches those by lines I will be putting in that amount in three times Leverage

XRP to the mooon!CRYPTOCAP:XRP - @Ripple
Building the Internet of Value.🥇
#XRP has remained strong above $2, while many altcoins have recorded new lower lows this month.
XRP’s resilience during a bearish phase suggests that it will likely outperform the overall market during bullish phases.🚀

XRP next potential move to $4.00 !Between now to 17 March - Potential scenario's for XRP
Bearish scenario's
3D RSI need to break 55 . If reject at around 55 or lower, it will go downtrend to 28 or below. Look for signs if crossing the SMA yellow line for bullish move.
MACD on 3D showing hope for uptrend but lets see if it breaks above by 17th Mar.
Full Moon indicator printed today, usually marks the downtrend scenario to begin today till 29
March before a new moon begin
* A potential rejection can happen at $2.48 or $2.60 . If breaks above and stays there, then good.
* Ascending broadening pattern is generally bearish and it's a sign that it's nearing a significant resistance level it indicates an upward momentum is weakening and a potential breakdown can happen
Bullish scenarios
Daily candle looks good now but may be short-lived beyond the 17th Mar. So watch the movement towards this date
3D candle have been bearish since 22 Jan. 2nd half of March need to show upward strength
Candle bounced at 50 MA and showed signs of upward trend .
This ascending broadening wedge is quite unique in my opinion. It also shows the market is quite undecided about which direction to go and waiting for a violent move. But if you notice the trajectory, the likelihood is more is towards uptrend .
It needs to break the $2.48 and $2.60 with a volume for the pump to arrive at a new ATH of $4.00
Beyond $4.00 is the new price discovery zone and it's anyone's guess where it will go next. Perhaps back to $1.00 😅 for a cooling down retracement?
Next Likelihood Potential Move
↗️Bullish: 60%🟢
↘️Bearish: 40%🔴

Big pump incoming for XRPI send a signal for all to buy XRP as i said big changes is coming and the end of lawsuit with SEC had came to an end !!
XRP will hit over 3$ then passed over 5$ qnd its possible possible will hit 10$ worth of XRP.
Keep holding and dont sell

XRP'S PATH IS OVER AT $2.335 and I have a safe sell.7This is crazy Chad, when this ends and I'm positive we're going to go to the second round and you see I've already got those lines prepared I didn't measure them with the vertical line that I created from the first run and overlaid it to the second run and it matches and I thought okay this is one two three four and I've got to have one more so you'll see where my cell lines in that third echelon and that red line is my safe cell okay I want to get out on that line even though it could go a little bit higher but that's as far as it's going to go and then this whole thing is going to fall down we're not going to $2.48 we're not going to $2.52 and we're not going to any other number above $2.32 on the safe side and know that overall on this Market this is a down Market so we're profiting up in the down market and we still got two more times to do it and double down each time remember I'm doing 3XL which is three times the bonus profit that I get for the amount of participation that I'm giving I'm buying billion

XRPUSD Long PositionEntry: 2.21337
Stop Loss: 1.28211
Take Profit 1: 3.40000
Take Profit 2: 5.00000
Take Profit 3: 7.50000

I sold the three lots to buy back lowerI sold the three lots to buy back lower with each slot being approximately $2,500 in sales I still believe this is going up to about $2.58 however I'm buying back over on this candle with two and a half hours remaining on this 4-Hour chart
XRP will explode in valuePrice Movement and Trends
Initial Consolidation (August 2024 - November 2024):
XRP starts the chart trading sideways around $0.50 to $0.60. This period shows low volatility with small candlesticks, indicating a lack of strong directional momentum. It suggests a consolidation phase where buyers and sellers were in balance.
Breakout and Uptrend (Late November 2024 - January 2025):
Around late November 2024, XRP breaks out of its consolidation with a sharp upward move. The price surges from $0.60 to a peak of around $4.00 by early January 2025, a massive increase of over 500% in a short period.
This rally is characterized by large green candlesticks, indicating strong buying pressure. The consistent higher highs and higher lows confirm a strong bullish trend.
Volume likely increased during this period (though volume bars aren’t visible), as such a significant price move typically requires high participation.
Peak and Correction (January 2025 - February 2025):
XRP reaches a high of approximately $4.00 in early January 2025, followed by a sharp correction. The price drops to around $2.50 by mid-February 2025, a decline of about 37.5% from the peak.
This correction is marked by large red candlesticks, showing strong selling pressure. The drop suggests profit-taking by traders who entered during the earlier rally, possibly triggered by overbought conditions (though no RSI or similar indicators are visible to confirm this).
Stabilization and Recovery Attempt (February 2025 - March 2025):
After the correction, XRP stabilizes between $2.50 and $3.00. The price shows smaller candlesticks and some consolidation, indicating a pause in the downtrend.
Toward early March 2025, XRP attempts a recovery, climbing back to $2.837 by March 13, 2025. The smaller green candlesticks in this phase suggest cautious buying, but the momentum isn’t as strong as the earlier rally.
Key Levels and Support/Resistance
Support: The $2.50 level acted as a support during the correction in February 2025. This level held multiple times, indicating buyers stepping in to defend it.
Resistance: The $4.00 level was a significant resistance, as it marked the peak of the rally before the correction. If XRP attempts another upward move, this level may act as a barrier.
Current Price: At $2.837, XRP is trading above the recent support but far below its January peak, suggesting it’s in a consolidation phase with potential for either direction.
Technical Observations
Volatility: The chart shows periods of both high and low volatility. The rally in November-December 2024 was highly volatile, while the consolidation phases (August-November 2024 and February-March 2025) show lower volatility.
Trend: The overall trend from November 2024 to March 2025 is bullish, despite the correction. The price is still significantly higher than its starting point in August 2024.
Candlestick Patterns: The large green candles during the rally and large red candles during the correction indicate strong momentum in both directions. The smaller candles in March 2025 suggest indecision in the market.
Potential Scenarios
Bullish Case:
If XRP breaks above $3.00 with strong volume, it could signal the start of another uptrend, potentially retesting the $4.00 resistance.
A move above $4.00 could open the door for new all-time highs, especially if market sentiment for cryptocurrencies remains positive.

XRPUSDAs shown in the image,
We are witnessing a bullish pattern
If the important support number 2 is lost, we can expect the bullish pattern to complete and take the price to the indicated levels.
If there is demand from the current price range and we have liquidity flowing into the market, we can expect to see new highs for Ripple.

Running xrp3s to targetsRunning xrp3s to targets
Showing you the look of the run on this short on the 12-hour chart again this is a long-term Trend with a short-term buyback

Xrp is going to the GREEN LinesXrp is dropping after going from $1.90 to $2.27 the difference is approximately 37 cents.
XRP is anticipated to drop between $2.158 and $2.183
Time to load up.
This is a temporary short on a long-term uptrend to $2.58

A clear investment pathA clear investment path.
Keep in mind, the Too may be around $2.52-$2.58
At sells, Buyback lower! If not hold. Don't chase candles!!!

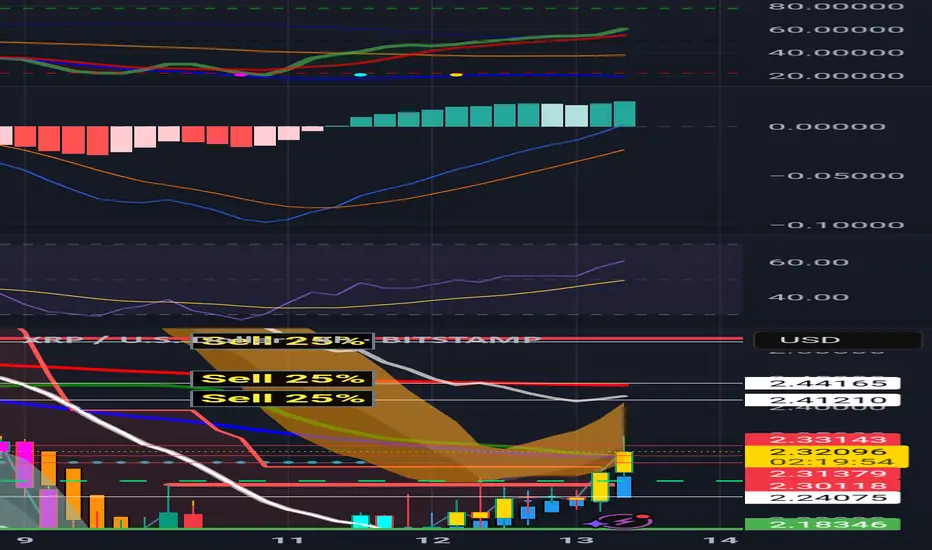
2.315 sell 25% and buy lowerlook at those macd white boxes but don't let that fool you... I suspect a possible pull back at near the 0.31-0.32 area. This will top out around $2.528 before shorting this market.
Next pullback, sell 25% at $2.382 area... this is what I'm doing.

Update on xrp...Currently we are in an uptrend even though ultimately we will be in in overall downtrend...
The entire blue box may get filled with red as freshly pulled back making an even better opportunity to buy more as this is going out.
This is why it's always good to have extra powder handy when you need to buy more

XRP | Rug is playing outPrice seems like its distributing more than looking to accumulate. Trumps inauguration was a market top call.

Question is when... and here is when.As chart shows, this is how i see things panning out. The only way to predict future minus entropy is through fractals.

Lower Local Lows for XRP?I'm making a fresh publish/idea for XRP.
XRP has been attracting a large crowd since its major rally up that started in November 2024.
As demonstrated in previous posts of mine, I am a fan of EW theory. Although it can be tricky to plot waves, It is a practice that I aim to master. It appears that we may developing the 5th wave of a 5 wave structure that normally marks the beginning of a larger time frame 3 wave correction; if this makes sense.
I will be using the VRVP (Visual Range Volume Profile) indicator in this TA; we are running into resistance at POC (yellow horizontal line). It's possible that price does not break above that point. The HVN (High Volume Node) signifies high resistance in that area. But if it did, that would be a major support structure.
Since price is currently in between significant resistance and support, I expect some sideways movement as buyers and sellers battle in between.
There is a chance that we retest February's low (The SC (selling climax) zone). If that is the case, that could turn into a ST (secondary test) event, with a possibility of a slightly lower low.
I have a plotted a support structure as the 0:1.272 window. This could be an Ideal area for a ST event if correction continues for this asset; as this is the next significant support area according to the HVN.
Good Luck Traders!
-NOT Financial Advice-

XRP/USD "Ripple vs U.S Dollar" Crypto Market Heist Plan🌟Hi! Hola! Ola! Bonjour! Hallo! Marhaba!🌟
Dear Money Makers & Thieves, 🤑 💰🐱👤🐱🏍
Based on 🔥Thief Trading style technical and fundamental analysis🔥, here is our master plan to heist the XRP/USD "Ripple vs U.S Dollar" Crypto Market. Please adhere to the strategy I've outlined in the chart, which emphasizes long entry. Our aim is the high-risk Red Zone. Risky level, overbought market, consolidation, trend reversal, trap at the level where traders and bearish robbers are stronger. 🏆💸Book Profits, Be wealthy and safe trade.💪🏆🎉
Entry 📈 : "The heist is on! Buy above (3.0000) then make your move - Bullish profits await!"
however I advise to placing the Buy Stop Orders above the breakout Level (or) placing the Buy limit orders within a 15 or 30 minute timeframe, Entry from the most Recent or Swing low or high level should be in retest.
Stop Loss 🛑: Thief SL placed at (2.7000) swing Trade Basis Using the 2H period, the recent / Swing Low or High level.
SL is based on your risk of the trade, lot size and how many multiple orders you have to take.
Target 🎯: 3.8000 (or) Escape Before the Target
🧲Scalpers, take note 👀 : only scalp on the Long side. If you have a lot of money, you can go straight away; if not, you can join swing traders and carry out the robbery plan. Use trailing SL to safeguard your money 💰.
📰🗞️Fundamental, Macro, On Chain Analysis, Sentimental Outlook:
╰┈➤XRP/USD "Ripple vs U.S Dollar" Crypto Market is currently experiencing a bullish trend,., driven by several key factors.
╰┈➤Fundamental Analysis
Network Congestion: Ripple's network congestion has decreased, with an average transaction time of 2 seconds.
Transaction Volume: The transaction volume for Ripple has increased by 12% in the last 24 hours.
Partnerships: Ripple has announced new partnerships with several financial institutions, increasing its adoption and use cases.
╰┈➤Macro Economics
Inflation Rate: The global inflation rate is expected to decrease to 3.1% in 2025, which could lead to increased demand for cryptocurrencies like XRP.
Interest Rates: The US Federal Reserve has maintained its hawkish stance, keeping interest rates at 5.25% to combat inflation.
Global Trade: The ongoing trade tensions between the US and China are expected to have a minimal impact on the cryptocurrency market.
╰┈➤Global Market Analysis
Cryptocurrency Market: The global cryptocurrency market capitalization has increased by 1.5% in the last 24 hours.
Bitcoin Dominance: Bitcoin's dominance has decreased to 40.1%, which could lead to increased demand for altcoins like XRP.
Altcoin Market: The altcoin market has increased by 2.5% in the last 24 hours.
╰┈➤On-Chain Analysis
Transaction Count: The transaction count for Ripple has increased by 10% in the last 24 hours.
Active Addresses: The number of active addresses for Ripple has increased by 5% in the last 24 hours.
Hash Rate: The hash rate for Ripple has increased by 2% in the last 24 hours.
╰┈➤Market Sentiment Analysis
The overall sentiment for XRP/USD is bullish, with a mix of positive and neutral predictions.
60% of client accounts are long on this market, indicating a bullish sentiment.
╰┈➤Positioning
The long/short ratio for XRP/USD is currently 1.6.
The open interest for XRP/USD is approximately 1.2 billion contracts.
╰┈➤Next Trend Move
Bullish Prediction: Some analysts predict a potential bullish move, targeting $3.20 and $3.50, due to the increased adoption and use cases of Ripple.
Bearish Prediction: Others predict a potential bearish move, targeting $2.60 and $2.40, due to the increased competition from other altcoins and the potential decrease in global cryptocurrency demand.
╰┈➤Real-Time Market Feed
As of the current time, XRP/USD is trading at $2.9000, with a 1.2% increase in the last 24 hours.
╰┈➤Future Prediction
Short-Term: Bullish: $3.00-$3.20, Bearish: $2.80-$2.60
Medium-Term: Bullish: $3.50-$3.80, Bearish: $2.40-$2.20
Long-Term: Bullish: $4.00-$4.50, Bearish: $2.00-$1.80
╰┈➤Overall Summary Outlook
The overall outlook for XRP/USD is bullish, with a mix of positive and neutral predictions.
The market is expected to experience a moderate increase, with some analysts predicting a potential bullish move targeting $3.20 and $3.50.
⚠️Trading Alert : News Releases and Position Management 📰 🗞️ 🚫🚏
As a reminder, news releases can have a significant impact on market prices and volatility. To minimize potential losses and protect your running positions,
we recommend the following:
Avoid taking new trades during news releases
Use trailing stop-loss orders to protect your running positions and lock in profits
📌Keep in mind that these factors can change rapidly, and it's essential to stay up-to-date with market developments and adjust your analysis accordingly.
💖Supporting our robbery plan will enable us to effortlessly make and steal money 💰💵 Tell your friends, Colleagues and family to follow, like, and share. Boost the strength of our robbery team. Every day in this market make money with ease by using the Thief Trading Style.🏆💪🤝❤️🎉🚀
I'll see you soon with another heist plan, so stay tuned 🤑🐱👤🤗🤩

The 12 Hour ChartThe 12 Hour Chart confirms the 1 week chart.
Overall, the TREND IS DOWN...
HOWEVER, THE SELL LINE IS:
$2.587
