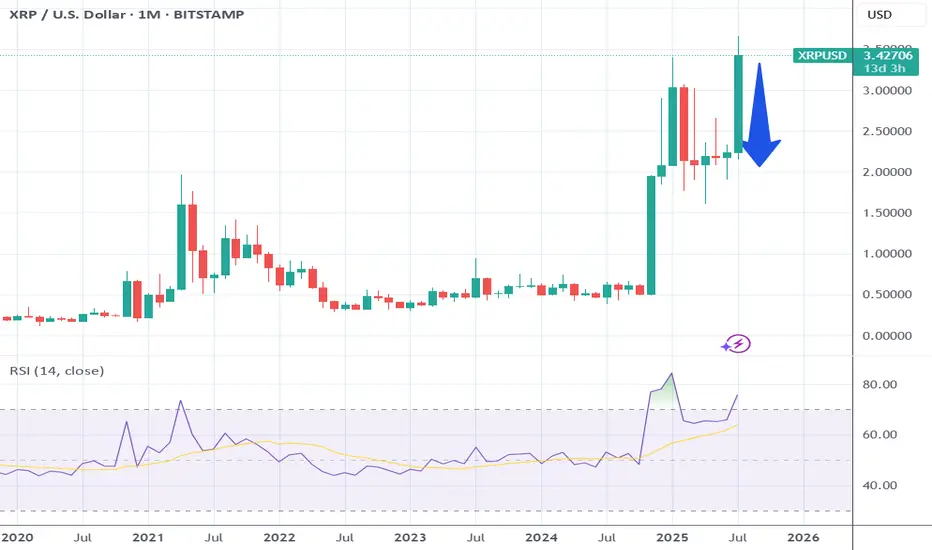
xrpusd monthlyjust woaw,
who will not like when the chart speaks itself and here it speaks itself
target is very logical, reasonable
we ll see in the future we would be there or not
RIPPLE trade ideas

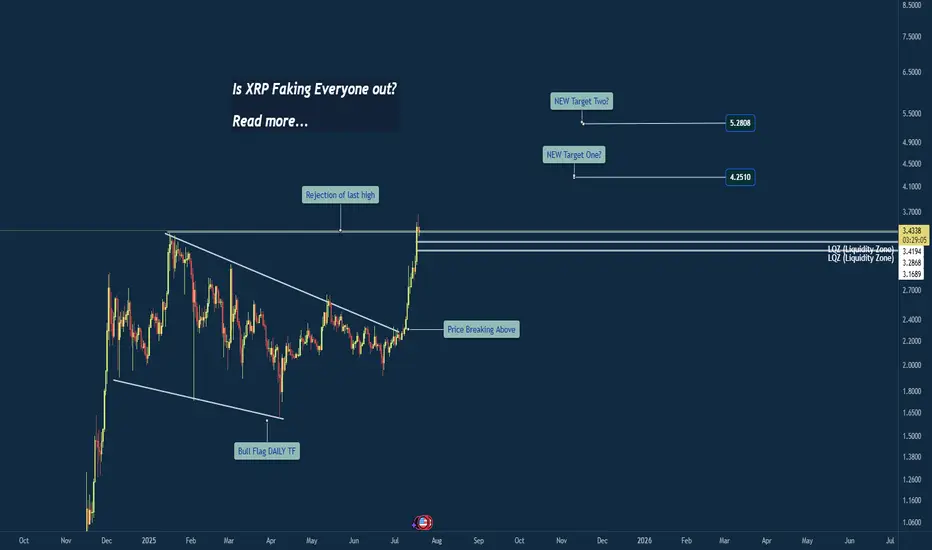
XRP - Ready for Next LegXRP recently made a new all time high at $3.66. But what we are seeing could give credit to even higher highs about to be developed.
What we have seen over the last few days of price action is market structure respecting our old 2025 ATH.
Any dips we have seen have developed lows between $3.30-$3.40. Creating this in to what seems to be a new level of support.
In this post we outlined how that yellow dotted line (key level) would play a role in future price action. So far that is what has happen and we are seeing beautiful market structure develop.
If XRP is to break the $3.66 level we are likely to see a rapid increase in price. Some of the levels that could end up becoming key levels for the future are these:
$3.90
$4.20
$4.50
$5.30

XRP to $10? 🚨 XRP to $10? Here's What No One Is Telling You 💣
XRP is quietly being tested as a global liquidity bridge by BRICS & Gulf nations. If Ripple powers the rails of future CBDCs…
$6.50 to $10 XRP becomes a math problem — not a fantasy.
✅ Ripple IPO incoming
✅ U.S. relisting possible
✅ Token supply shrinking
✅ Wall Street quietly watching
This isn’t hype. It’s the sleeper setup of the decade.
Would you hold XRP if it replaced SWIFT?

Based on real-world utility and institutional integrationXRP is evolving from a speculative asset into a strategic tool for global finance. If Ripple continues to convert partnerships into active XRP usage and ETFs gain traction, XRP could be a strong long-term play. But like all crypto investments, it demands careful risk management and a watchful eye on regulatory shifts
Hex on PulseChain mirrors XRP over time, $0.003 -> $3.40 (5yrs)Attention Poverty Investors 💀
While you were crying about your Hex bags at $0.003, XRP holders were getting absolutely REKT for 4-5 years straight. "Dead project!" they laughed. Then those same clowns FOMO'd in at $3 when XRP went nuclear in 2017.
1,133x gains for the psychopaths who didn't paperhand like little babies.
Now HEX sits at the EXACT same $0.003 graveyard for 5 years. Same high supply. Same "ngmi" energy. Same braindead price action that makes moonboys rage quit.
But here's the thing, anon: Alt-season is coming and history doesn't give a %$@! about your feelings. When high supply coins pump, they pump VIOLENTLY. Ask the XRP OGs who went from eating ramen to driving Lambos.
Translation for smoothbrains:
HEX at $0.003 for 5 years = XRP at $0.003 for 5 years.
If you can't see the pattern, stay poor.
$3.40 HEX incoming? Maybe. Maybe not. But if you're not at least considering it, you're ngmi.
This is not financial advice, it's a reality check for all you $0.003 stablecoin holders 🤡
WAGMI or cope forever. Your choice.

XRP 1H Chart Analysis - Breakout PotentialThe price is currently testing the 0.702 resistance level on the 1H chart, a key zone with historical rejections. A decisive break above 0.702, confirmed by a strong bullish candle and higher volume, could target 1.363. If the price breaks above 1.000 with solid confirmation, XRP might enter price discovery, pushing toward uncharted highs.
Key Levels:
Resistance: 0.702 (current), 1.000 (major), 1.363 (next target)
Support: 0.469, 0.382, 0.236
Strategy:
Enter long on a confirmed break above 0.702, aiming for 1.363, with a stop-loss below 0.469 (1:2 risk-reward).
For a 1.000 breakout, go long with a stop-loss below 0.702, using a trailing stop as prices extend.
Watch for volume spikes to validate moves.
Alerts:
Set an alert at 0.702 for a 1% break above.
Add an alert at 1.000 for a 1% break above to catch price discovery.
Stay cautious of false breakouts and monitor real-time data for confirmation.

XRP consolidation close to done, 10$ next- update on this analysis, made more than half a year ago:
- since then Ripple has been consolidating at a high level
- history doesn´t repeat but it does rhyme is the famous saying - in case of XRP it looks like price action is literally repeating the 2017 playbook with an initial impulse - consolidation - followed by another impulse
- target of the macro triangle pattern is north of 10$ per XRP, likely to get reached by the end of the year

Ripple analysis, long-termAccording to the latest analysis, Ripple's price rose from $0.50 to $2. Further, the price is analyzed to be likely to decrease to the $1 range with a dark $4 and $3.50, which in the long term can be expected to increase Ripple to this price range.
Sasha charkhchian

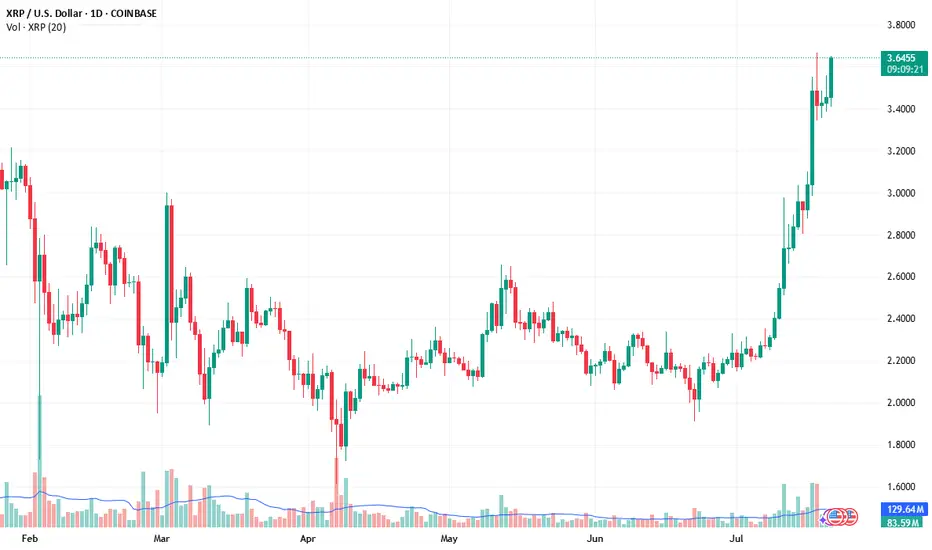
XRP Weekly ChartPrice made new ATHs on Friday went as high as $3.66, taking out the previous high at $3.39.
See if this week closes above, the monthly candle would give a stronger confirmation.
Anything could take price to $5+ or back down to $1.

XRP : KEEP simpleHello there.
Simple chart. XRP will never 3.50 probably again if we look chart. Is this a false breakout ? Just wait the confirmation in Weekly first, and monthly second.
This can be brutal. Like LTC and XLM, CRYPTO dino.. will run the world. I'm not a augur, but we look only the chart.
Good luck... Spot here is very good, you miss all ? Don't worry, you can gain a lot here, and if not, don't worry the life always end.
Good luck

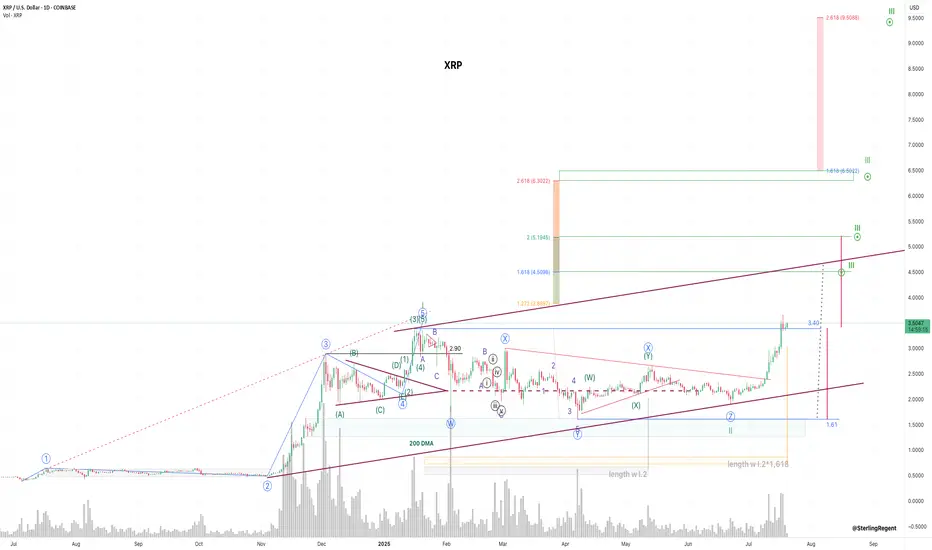
XRP zoomed out - do you see what I see. XRP weekly chart closing above the 5 years old ATH might be signaling extended level. Follow the Fib-extention where to expect it.

XRP will go higher XRP is bullish all i see is bullish; can go higher.
First 4$ , 5$ and then higher and above. Anyone who's holding XRP you will be very rich.

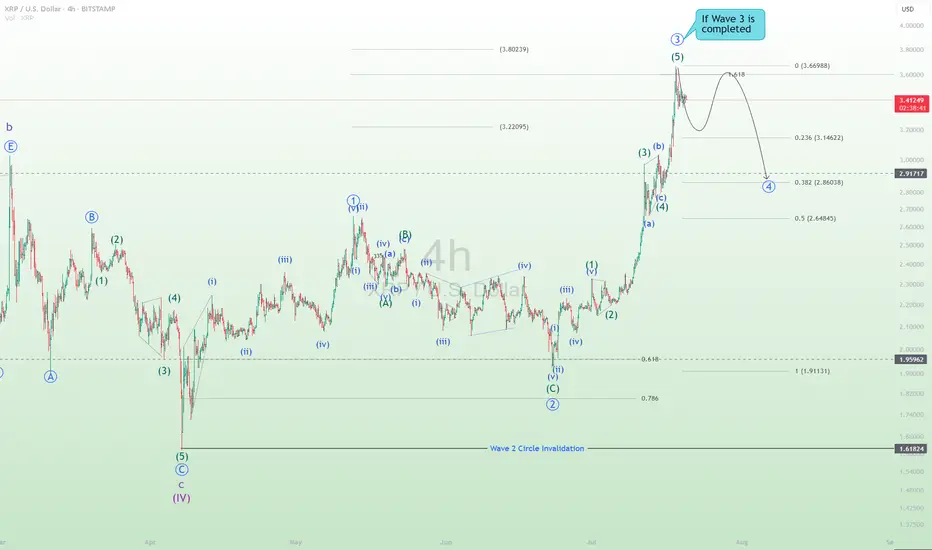
XRPUSD - If Wave 3 is completedNow we see XRPUSD reached the level 1.618, a trader's psychological level for wave 3. If most traders take profit at this level accompanied by big volume, most probably we are going to see a new downtrend of wave A of wave 4.
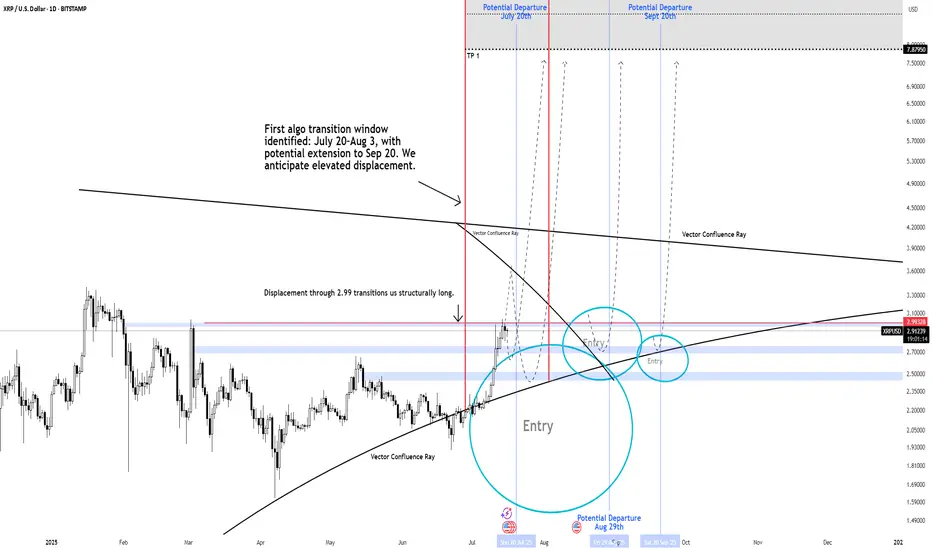
XRP THE $2.99 "NUKE" LEVEL Could Send Price To $30 to $100+ Primary Expansion Window: July 20 – Aug 3, 2025 (potential extension to Sept 20)
XRP is positioned for a structural regime shift. The pivotal $2.99 "nuke" level is on watch a clean break through this price isn't just an ignition, it's the catalyst for explosive directional flow. As algorithms flips long above $2.99, Wave 1 is triggered, opening accelerated risk toward the $30 target during this active expansion window.
Vector Confluence Rays: Dynamic Support/Resistance. order flow and price memory become most active these are potential launch points for expansion or resistance.
Nuke Level ($2.99): The term signals more than a trigger it's the critical inflection where algo's initiate volatility and momentum. When breached, price will accelerate.
What’s Next After Wave 1?
Second Expansion Window: November to December 2025
When momentum and higher timeframe structure persist, a larger breakout framework comes into play with targets of $60, $100, and, in extreme scenarios, $1,500+ if a full structural unlock unfolds.
Key Takeaways
$2.99 is the “nuke” level: The breakout ignition for Wave 1. Algo's are highly likely to accelerate above this line, targeting upwards to $30 within the first expansion window.
Lower probability predictive models do show price can reach $60 Wave 1 in extreme cases.
Expansion windows defined: First window live July–September; second window November–December for further upside potential.
Above $2.99: Upside is highly probable the algo is primed and with years of price suppression means acceleration is very likely once this level breaks.
-Neverwishing
Breakout or Bull Trap? XRP at Critical Weekly LevelWeekly Chart Insight: XRP Closing Above Previous High
XRP has just closed above its previous weekly high—a significant development that could signal a shift in market sentiment. Historically, when price closes above such a critical level on the weekly timeframe, it often leads to continuation, unless a sharp rejection quickly follows.
At this stage, the focus shifts to the 4-hour timeframe for confirmation. An impulsive move above the current consolidation zone could indicate that this breakout is legitimate, potentially leading to another bullish weekly candle.
However, caution is warranted. If the next two daily candles close weakly or fail to maintain structure above the breakout level, it could hint at a fakeout or liquidity grab before a deeper correction.
My Current Bias:
I remain neutral-to-bullish, contingent on:
An impulsive continuation on the 4HR
Strong daily closes above the key range
Price not falling back and closing below the weekly breakout level
If price begins to consolidate and hold this level, that would reinforce the bullish case. But if we see immediate selling pressure and a re-entrance below the breakout, I’ll reconsider the bias based on developing structure.
XRP's New Dawn: Beyond Bitcoin, Towards a Double-Digit Horizon
The cryptocurrency landscape is witnessing a seismic shift, and at its epicenter is XRP. In a stunning display of market dominance, the digital asset has embarked on a historic rally, fundamentally altering its perception and potential. Leaving the market's traditional bellwether, Bitcoin, in its wake with a colossal 277% outperformance over the past year, XRP has shattered its previous records. The token recently soared to a new all-time high of $3.66, pushing its market capitalization beyond the monumental $210 billion mark for the first time. This explosive growth, fueled by a confluence of regulatory triumphs, institutional validation, and overwhelming market momentum, has ignited the community and brought a once-fanciful question to the forefront of serious financial discussion: Is a $10 valuation the next logical destination for XRP?
This article delves into the multifaceted narrative behind XRP's meteoric ascent. We will dissect its remarkable outperformance against Bitcoin, explore the pivotal legal and regulatory victories that cleared its path, analyze the flood of institutional capital now entering the ecosystem, and examine the technical and on-chain data that suggests this rally may have only just begun.
Chapter 1: A Declaration of Independence - XRP's Decoupling from Bitcoin
For most of its existence, the cryptocurrency market has marched to the beat of Bitcoin's drum. Its price movements dictated the sentiment and direction for nearly all other digital assets. The year 2025, however, will be remembered as the year XRP declared its independence. The asset's 277% yearly surge against Bitcoin is not a mere statistical anomaly; it represents a fundamental rerating by the market, a recognition of XRP's unique value proposition, which is now unburdened by past uncertainties.
This divergence is starkly visible in recent trading. During the month of July alone, XRP appreciated more than 35% against Bitcoin, a powerful indicator of shifting capital flows and investor preference. While Bitcoin's narrative remains firmly rooted in its identity as "digital gold" and a hedge against inflation, XRP's story has evolved into one of proven utility and regulatory legitimacy. This newfound clarity has allowed its price to reflect its potential as a bridge currency for global payments and a cornerstone of a new, more efficient financial infrastructure.
The psychological impact of this rally has been profound. Prominent personalities like Dave Portnoy have publicly lamented selling their XRP holdings prematurely, echoing a sentiment of regret that is likely widespread among investors who exited their positions during the long years of legal ambiguity. This fear of missing out, while a potent market force, is not the sole driver of the current momentum. The rally is built upon a much sturdier foundation of institutional adoption and clear fundamental catalysts, suggesting a more sustainable trend than the speculative frenzies of the past.
Chapter 2: The Victory Lap - Regulatory Clarity as Rocket Fuel
The single most significant factor unlocking XRP's potential has been the definitive conclusion of its long and arduous legal battle with the U.S. Securities and Exchange Commission (SEC). The lawsuit, initiated in late 2020, had acted as a lead weight on the asset, alleging that Ripple's sales of XRP constituted an unregistered securities offering. This created a cloud of regulatory risk that kept many institutional investors and potential partners on the sidelines, particularly in the United States.
The tide began to turn with a landmark court ruling that determined XRP, when sold on public exchanges to retail customers, did not meet the definition of a security. This decision was a watershed moment, providing the legal clarity the secondary market desperately needed. The final chapter of this saga unfolded in 2025 as the SEC opted to drop its appeal and the parties moved to finalize a settlement. This resolution effectively ended the years of uncertainty that had suppressed XRP's value and stifled its adoption in the U.S.
This legal victory could not have come at a more opportune time. It coincided with a broader, increasingly constructive regulatory climate in Washington. The successful passage of several crypto-focused bills through the U.S. House has signaled a move towards establishing clear rules of the road for the digital asset industry. This favorable regulatory tailwind has not only vindicated Ripple's long-standing arguments but has also paved the way for the development of regulated financial products built around XRP, transforming it from a legally contentious asset into a compliant component of the future financial system.
Chapter 3: The Wall Street Endorsement - The Influx of Institutional Capital
With the legal clouds parted, the floodgates for institutional capital have swung wide open. The most tangible evidence of this is the enthusiastic race to launch XRP-based Exchange-Traded Funds (ETFs). An ETF is a mainstream investment vehicle that allows investors to gain exposure to an asset like XRP through their traditional brokerage accounts, representing a critical bridge between the worlds of crypto and traditional finance.
Financial services giant ProShares has led the charge, successfully launching a leveraged XRP futures ETF. The approval of such a sophisticated product by regulators is a powerful endorsement, signaling a high degree of comfort with XRP's market structure and legal standing. ProShares is far from alone; a veritable who's who of asset managers, including Bitwise and 21Shares, have also filed applications for their own XRP-based funds. The sheer volume of these filings from established Wall Street players underscores a deep and proactive institutional belief in XRP's long-term potential.
This institutional stampede is further reflected in the booming derivatives markets. Daily trading volume in XRP futures has swelled to over $235 million, while open interest—a measure of the total value of active contracts—has soared to a record high. This is the unmistakable footprint of large, sophisticated investors using these markets to speculate on and hedge their exposure to XRP. The recent price surge was amplified by a significant "short squeeze," where traders betting against XRP were forced to buy back their positions at higher prices, adding further fuel to the rally. This is not the behavior of a retail-driven fad; it is the mechanics of a market now dominated by serious institutional demand.
Chapter 4: Reading the Digital Tea Leaves - On-Chain and Whale Activity
A deeper look at the blockchain itself provides further compelling, if nuanced, insights. On-chain data reveals a fascinating dynamic among the largest holders of XRP, colloquially known as "whales." On one hand, there have been significant transfers of XRP from Ripple co-founder Chris Larsen to centralized exchanges, a pattern that often precedes selling. Throughout 2025, Larsen has moved hundreds of millions of dollars worth of the token, which could be interpreted as early insider profit-taking.
However, this potential selling pressure has been more than absorbed by a much broader trend of accumulation. Market data clearly shows a steady pattern of buying by other large, institutional-grade investors. It appears a new class of whales is confidently accumulating any supply that becomes available, creating a powerful and sustained tailwind for the price.
Adding a layer of data-driven optimism is the Market Value to Realized Value (MVRV) ratio. This advanced metric, which compares XRP's current price to the average acquisition cost of all coins in circulation, recently flashed a signal that has historically preceded enormous rallies. The last time this particular indicator showed a "golden cross," it heralded a massive 630% surge in XRP's price. While past performance is no guarantee of future results, this historical precedent provides a powerful data point that aligns perfectly with the bullish fundamental narrative.
Chapter 5: Charting the Uncharted - Price Analysis and Future Targets
The culmination of these powerful catalysts has produced breathtaking price action. In a single 24-hour period, XRP's price leaped by 22%, decisively breaking its former all-time high and entering a phase of pure price discovery. Technical analysts have described the move as a textbook breakout following a long period of accumulation, a pattern that often leads to powerful and sustained upward trends.
With no historical resistance levels overhead, analysts are now turning to technical patterns and Fibonacci extension models to project potential future targets. A prominent "bull pennant" formation on the price charts suggests an astonishing long-term target of $14. More immediate, conservative targets are clustered around the $4.00 and $4.80 levels, which many believe are well within reach if the current momentum is maintained.
This brings the conversation to the ultimate question of a double-digit valuation. Can XRP realistically reach $10 or beyond? A growing chorus of analysts believes it can. Projections for the coming years vary, but many models point to a future where XRP trades comfortably in the double digits. Forecasts for 2030 range from a conservative $4.35 to more aggressive targets of $16, $22, and even higher. These predictions are not based on pure speculation but are rooted in the assumption that the institutional adoption unlocked by ETFs and Ripple's expanding global payment network will continue to drive demand and utility.
Conclusion: A New Era for XRP
XRP's recent performance represents more than just a bull run; it signifies a fundamental transformation. It has emerged from a crucible of legal and regulatory challenges not merely intact, but stronger, more resilient, and with a clear mandate in the world's most important financial market. This hard-won victory has unleashed a powerful synergy of positive forces: the validation of institutional capital, the tailwind of a favorable regulatory environment, and the overwhelming evidence of bullish technical and on-chain metrics.
Its decisive outperformance of Bitcoin marks a coming-of-age moment, proving that a digital asset with clear utility and legal standing can forge its own path and command its own powerful market narrative. While the future in any financial market remains unwritten, the convergence of factors supporting XRP has never been stronger. The conversation has irrevocably shifted. The question is no longer if XRP can reclaim its former glory, but rather how high its newfound momentum can carry it. For a rapidly growing number of investors, analysts, and institutions, the $10 price target has evolved from a distant fantasy into a plausible, and perhaps even imminent, reality.
Once Again You Are Getting Ripped Off On XRP.Pro Crypto President.
SEC Case.
Mass Adoption.
Multiple Partnerships
Mainstream
Huge Volume The Last Year
ETF Approval
Crypto Bills Passed By Congress
Still cant beat 2017 All Time Highs. They are ripping you off on the price action...!
Whats the catalyst going forward?
The Feds are soon going to cut rates multiple times. Bitcoin tanks everytime when that happens.
This was a crypto pump into whats coming.
This will close with a Monthly double top and August Starts the free fall.
XRP - RALLY!!! 2017 YEAR! LET'S RUN!🔍 Major observation:
Back in 2017, when Bitcoin reached its cycle top, XRP began a massive rally, which marked the beginning of the bear market.
📊 Currently, XRP's structure looks almost identical to 2017 — we've broken out of accumulation.
Is it time for the final rally?
📉 I'm betting that BTC won’t make a new all-time high, while XRP surges to $8+, kicking off the next bear market!

Buy the dip. BullishWhen xrp breaks out of this pattern we can expect much more upside. Entering price discovery.

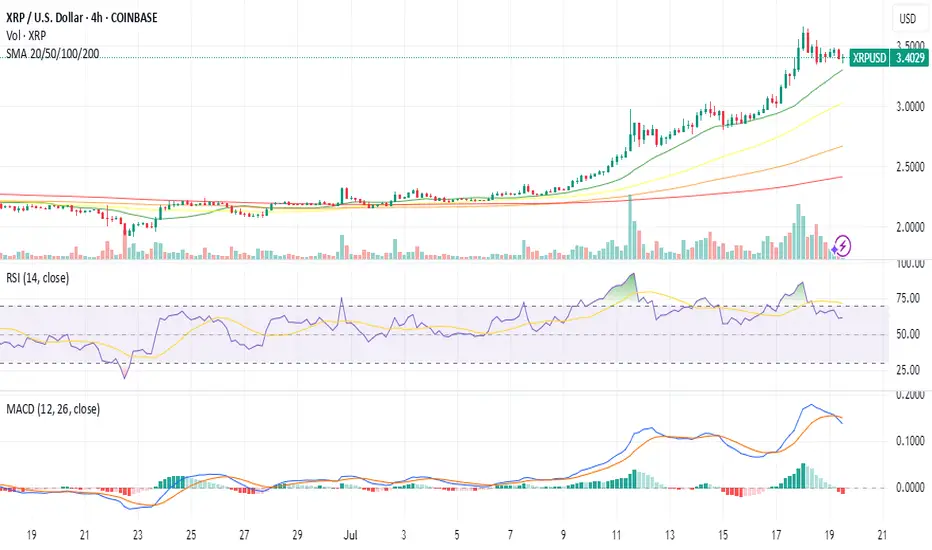
XRP Intra-day Analysis 18-Jul-2025Price action on XRP has shown upward momentum after reaching the 3.7 price level.
Possible scenarios include:
* The 3.3 level could come into focus if the market revisits this area. Market participants may monitor it for signs of seller exhaustion or potential reversal patterns.
* Should the price move lower, the 3.0 level may act as the next key area of interest. This round number is often viewed as a psychological level and may attract increased attention from traders.
* If there is a clear intraday move below the 3.0 level, the 2.6 area could emerge as another notable zone that some participants may consider relevant for future market reactions.
Disclaimer: easyMarkets Account on TradingView allows you to combine easyMarkets industry leading conditions, regulated trading and tight fixed spreads with TradingView's powerful social network for traders, advanced charting and analytics. Access no slippage on limit orders, tight fixed spreads, negative balance protection, no hidden fees or commission, and seamless integration.
Any opinions, news, research, analyses, prices, other information, or links to third-party sites contained on this website are provided on an "as-is" basis, are intended only to be informative, is not an advice nor a recommendation, nor research, or a record of our trading prices, or an offer of, or solicitation for a transaction in any financial instrument and thus should not be treated as such. The information provided does not involve any specific investment objectives, financial situation and needs of any specific person who may receive it. Please be aware, that past performance is not a reliable indicator of future performance and/or results. Past Performance or Forward-looking scenarios based upon the reasonable beliefs of the third-party provider are not a guarantee of future performance. Actual results may differ materially from those anticipated in forward-looking or past performance statements. easyMarkets makes no representation or warranty and assumes no liability as to the accuracy or completeness of the information provided, nor any loss arising from any investment based on a recommendation, forecast or any information supplied by any third-party.

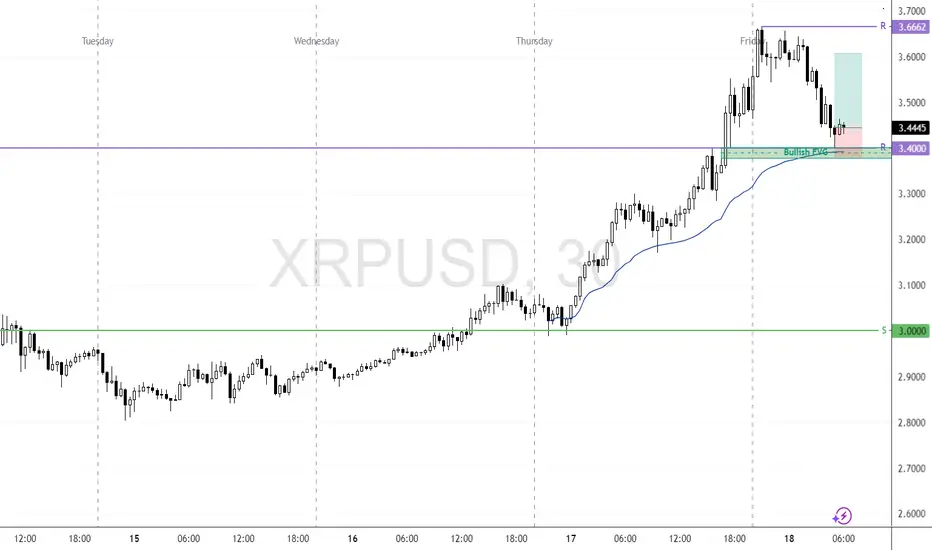
XRP Retests Previous All-Time High as Bullish Setup DevelopsFenzoFx—XRP (Ripple) is tested and has stayed above $3.40, the previous all-time high. This level acts as support, backed by the VWAP from Thursday's low and the bullish FVG.
If this level holds, we expect the cryptocurrency to aim higher, targeting $3.60, followed by $3.66.
XRPUSD - Why I see that Ripple even higherMedianlines, aka "Forks" have a simple but effective ruleset inherent. These rules describe the movement in certain situations. And of course, the most probable path of wher price is trading to.
Here we a rule in play that projects more movement to the upside, even if BTCUSD has had a strong pullback to the south.
Let's see:
If price is closing above a Centerline, then chances are high that it will retest it. If it holds and starts to continue it's path (to the upside), then the next target is the U-MHL, or the Upper Medianline Parallel, was Dr. Allan Andrews named it back many decades ago.
So, there we have it.
Chances are high that Ripple will reach new highs, with a final target at the U-MLH.
