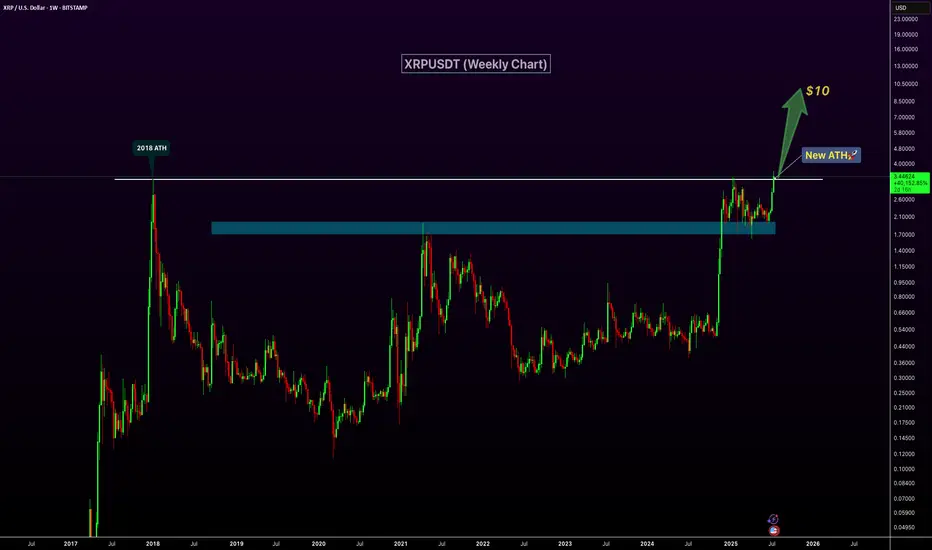
XRP Breaks 2018 High – New ATH Confirmed!XRP has officially broken above its 2018 peak, signaling a major bullish breakout and printing a new all-time high on the weekly chart. The previous resistance zone around $2.6–$3 has now flipped into strong support, confirming the strength of this move. With increasing volume and momentum behind the rally, XRP appears well-positioned for continued upside. The next key psychological target lies at $10, and current price action suggests a clear path toward that level. If bullish sentiment continues, this breakout could mark the beginning of a significant new uptrend.
RIPPLE trade ideas
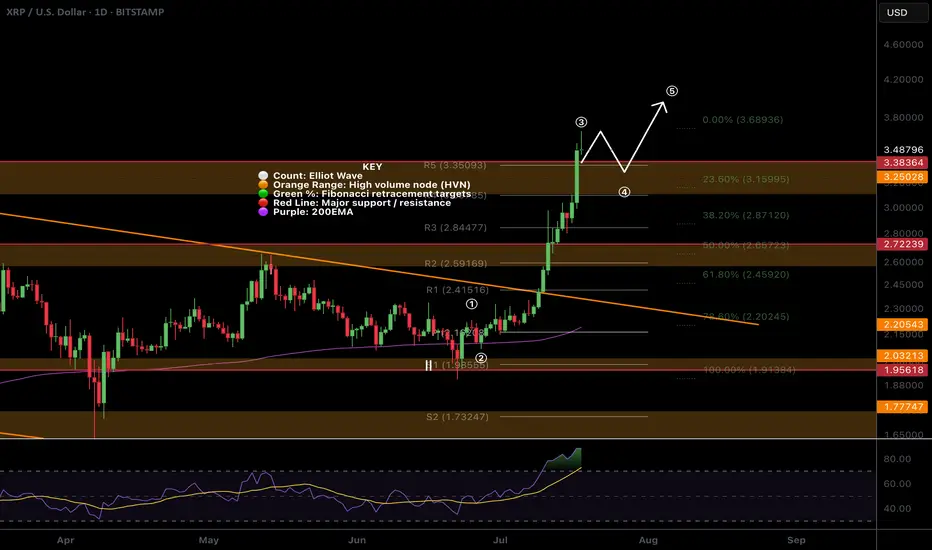
$XRP All time high! Time to sell or...?CRYPTOCAP:XRP appear to have completed wave 3 with a poke above all time high, typically this os behaviour of a wave 5.
The daily R5 pivot point has been breached so there is a significant chance of a decent pullback now but I wouldn't bet against the trend!
Wave 4 could be shallow, targeting the previous all time high, High Volume Node with waver 5 completing near $4.
Daily RSI is overbought but no bearish divergence yet which will likely emerge during wave 5.
Safe trading
Smart Money Trap or Final Push? | XRPUSD Ready for Rejection Professional XRPUSD Analysis (18 July 2025)
XRPUSD has shown a parabolic move recently, tapping into a high-probability resistance zone between $3.80 – $3.89, an area where liquidity likely sits for institutional players. Price reacted strongly upon entry, suggesting buy-side liquidity was swept and now potential distribution is in play.
🔑 Key Zones:
Resistance: $3.80 – $3.89 (potential reversal zone)
Target (Short-Term): $3.17
Strong Support: $1.80 – $2.00
🧠 Smart Money Perspective:
Market Structure Break (MSB): A clear sign of a possible internal shift after the impulsive rally.
Liquidity Sweep: Price wicked into resistance before pulling back — a classic trap for late buyers.
Expected Play: Look for a possible lower high formation, then continuation towards the target at $3.17.
📉 Trade Idea: A short opportunity can be considered if price fails to reclaim above $3.80 and shows further bearish price action or supply zone rejection confirmation.

XRP Special UpdateJust wanted to give y'all a heads up that XRP is within the target box for (5) of ((3)). If you look up my old posts from March and even as far back as January, you will see I have not changed this chart at all. It is doing exactly what the pattern had been telling us it would. I went ahead and sold the rest of my position, so I am now flat XRP. Will it move higher still yet? I believe it will, yes. However, it could turn around very soon so I found it better to collect my profits while I had the opportunity. A wise man once said, "profit is a thief, take it while you can." Don't get greedy in this game, or you will come to regret it!
FYI: I think the 1.382 is a reasonable place for this pattern to end. If we can get a 3-wave retracement, there is a high probability I re-enter with tight stops for another leg higher.

XRP LONG TO ATHs! Ripple XRPUSD RLUSD XRP is Bullish to $4 at the very minimum. We successfully completed our retrace down to $1.95 to the dot. Expecting that to be our final support area and to start seeing consolidation, and upwards momentum. Media hype hasn't started yet, BTC is losing market dominance similar to 2017 2018. We are on the verge of another Diamond Hands bull run. Make sure to take some profits when emotions are hitting super dopamine levels of euphoria. The final pump happens fast and retraces even faster. The volatility will be insane.
Well keep tabs on this as the weeks go by. Good luck you beauties!

[$XRP] [$XRP] levels - best guess - quick video updateCOINBASE:XRPUSD
no financial advice.
quick update to crypto: XRP ✨😎👍
*correction: While showing the 'volume areas' -> there are no 'ASK (Sell-Orders)' to be filled; so we are directly pushing through it atm


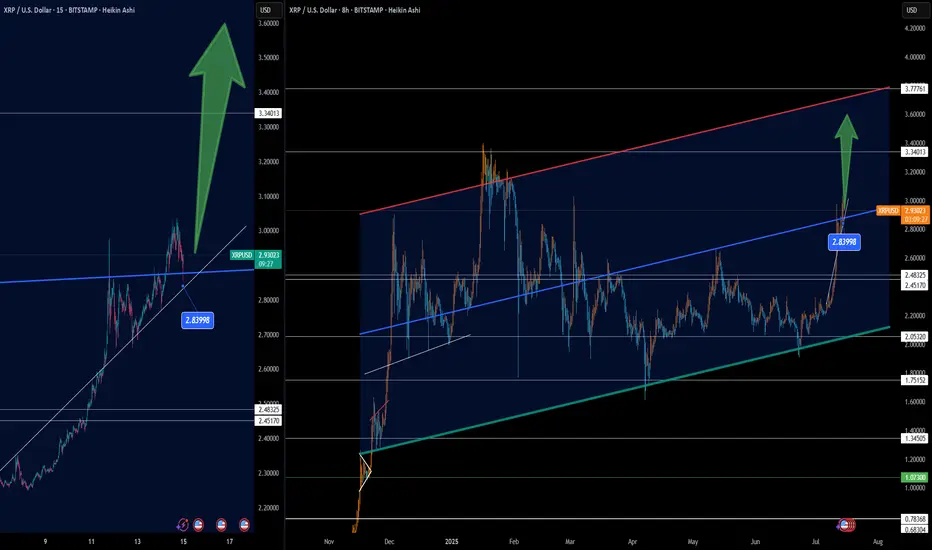
XRP Bullish Continuation Eyes Key Resistance at $3.34🚀📈 XRP Bullish Continuation Eyes Key Resistance at $3.34 💥🧠
XRP is showing remarkable strength as it continues to push higher within a well-defined ascending channel. On the 8H chart, we can see price breaking through mid-channel resistance, now retesting the zone around $2.84. This level acted as both a prior resistance and now potentially a launchpad for the next leg up.
The structure suggests:
🔹 A breakout retest scenario, confirming bullish continuation
🔹 Immediate resistance at $3.34, followed by the upper boundary of the channel near $3.77
🔹 Strong support from the dynamic trendline and former breakout zone
The 15-min Heikin Ashi view reinforces momentum: price is respecting the ascending trendline and holding above key breakout levels.
📊 As long as price holds above $2.84, this breakout remains valid, with the potential to target the upper channel resistance.
Technical traders may be watching for:
✅ A bullish engulfing or confirmation candle near current levels
✅ Volume spike on retest bounce
✅ Divergence or RSI confirmation on lower timeframes
Patience pays when structure aligns. Let's see if XRP delivers the full move.
One Love,
The FXPROFESSOR 💙
Disclosure: I am happy to be part of the Trade Nation's Influencer program and receive a monthly fee for using their TradingView charts in my analysis. Awesome broker, where the trader really comes first! 🌟🤝📈
Long - XRP (Weekly Chart)Long Swing Position
Perfectly bounced from .618 and RSI above 50. Expect the bullish momentum
Entry : $2.15
Resistance: $2.3
PT1: $2.7
PT2: $3.39
PT3: Update after crossing PT2
Stop loss: If it shows sign of weak rally to the upside, RSI cross below 50. Stop loss below fib 0.5 at $1.9 & monitor price movement when hitting fib 0.618 -> stop loss below it or re-entry when showing strong rally sign.

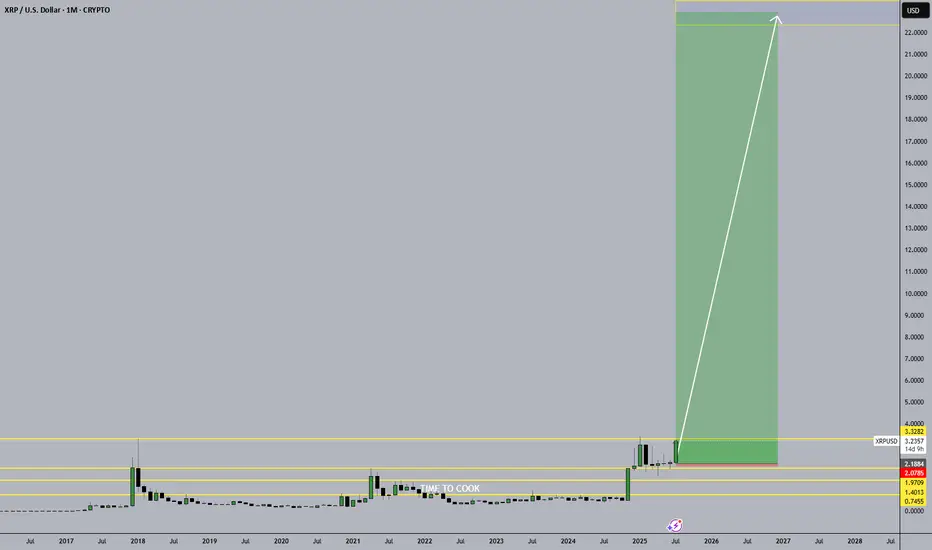
The RATS are out of the KITCHEN. It's TIME to COOKA simple trade - looking for XRP > $22 by December 2026, if it survives this breakout.
A token backed by dark state money.
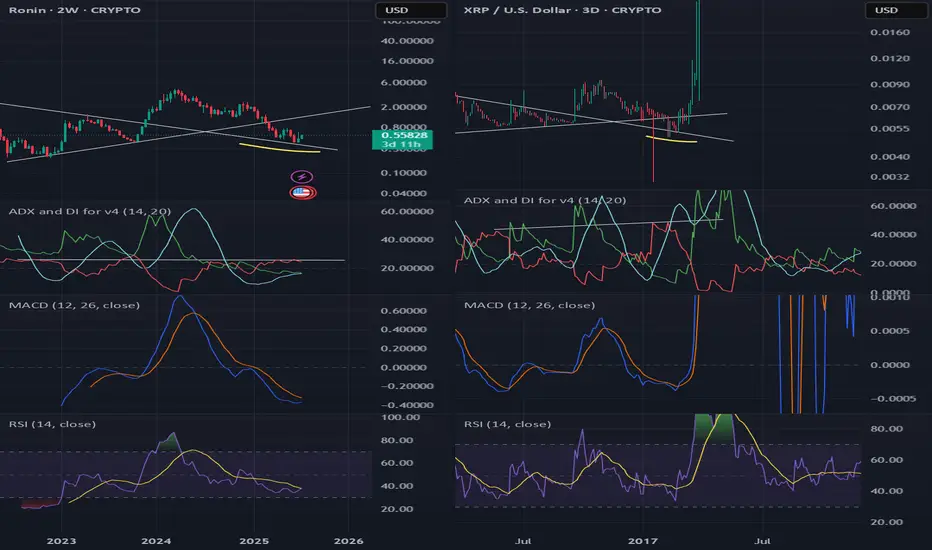
XRP of 2025 is not XRP of 2017. But Ronin could be.You guys need to have some self awareness, that the magic happens just once, maybe twice in life. The 700x+ move in 2017 isnt happening in 2025. 2024-2025 is different, up? yes xrp will go up but not 1000x.
XRP: Order Block at $3.40 Could Cap The RallyFenzoFx—Ripple's bullish momentum resumed nonstop, offering no clear pullback for entry. Currently, XRP is testing resistance at $3.40 within an order block. Momentum indicators remain in overbought territory, signaling short-term overpricing.
Volume profile shows limited resistance at present levels, suggesting a likely retest of $3.40. If this resistance holds, a pullback toward support around $3.00 is expected. This level can provide a discount to join the bull market.

Fractal Heaven!!To me this seems like the perfect outcome of why we're starting to really push up! We've had 3 clear fractals in play on the moves higher. And you can see at the green line, it all flattened out, and it showed with the first 2 fractals that it wasn't heading lower. Fractals are incredible indicators as you can see.

XRP: 22 Minutes to LIFT OFF!I'm bullish, no question about it.
I wouldn't want to be on the other side of this trade right now. Everything I'm seeing points to a strong move coming soon.
Weekly cross is giving confirmation.
Bullish engulfing on the hourly, with momentum building across lower timeframes.
Price action suggests we're setting up for a retest of the previous ATH, and there's a real possibility of printing new highs from here.
Season’s about to kick off — I’m positioned accordingly.
Due in 15 minutes

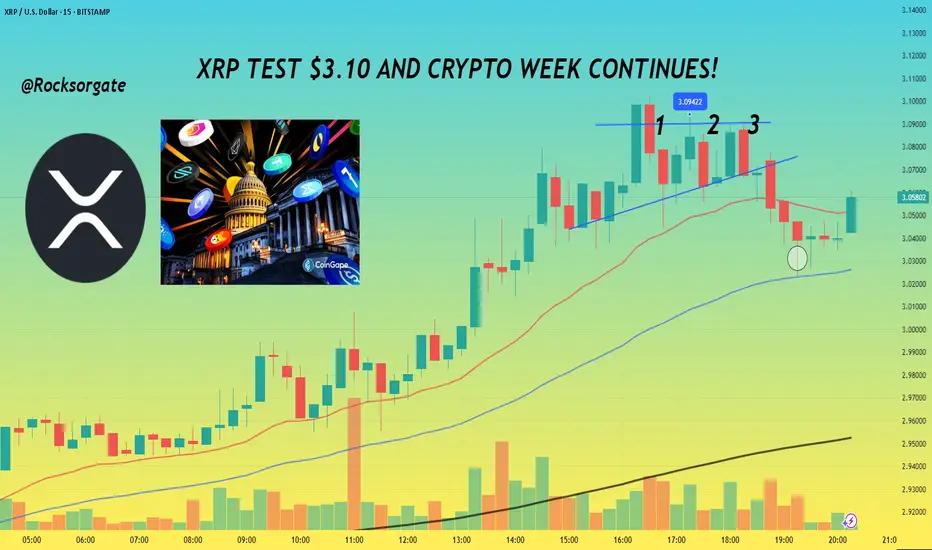
XRP TEST $3.10 AND CRYPTO WEEK CONTINUES!📊 Hey hey, hope all is well, gonna keep this idea pretty short and concise for the day, have a lot to do but thanks for joining as always.
📊 With Crypto week ongoing and the House of Representatives considering the Guiding and Establishing National Innovation for U.S Stable coins or GENIUS for short. Alongside that there's the Digital Asset Market Clarity Act or Clarity for short which is being considered as well. The last bill being considered is one which would be directed towards blocking the Federal Reserve from issuing a central bank digital currency directly to individuals.
📊 For summary CBDC is fiat money, just in digital form and that fiat money is issued and regulated by a central bank of a country.
📊 GENIUS has already made the rounds and passed through senate but is facing a snag, in limbo as House lawmakers as some lawmakers like Marjorie Taylor Greene and Chip Roy who themselves we're looking to get anti-CBDC language in with 12 republicans voting no on Tuesday's vote. Least to say things are still in flux, so we'll have to see if lawmakers can come to an agreement and sort things out simply put.
📊 If passed GENIUS would require stable coins to be fully backed by U.S dollars or similar liquid assets. Along with this you'd have annual audits for issuers with a market cap of more than $50 billion and guidelines would be established for foreign issuance.
📊 the Clarity Act takes a full on approach to crypto and would create a clear regulatory framework for crypto, this would function through the U.S Securities and Exchange Comission and Commodity Futures Trading Commission will regulate the crypto space. Digital asset firms would also have to provide retail financial disclosures and separate corporate from customer funds. More than likely in a nod to the collapse that FTX brought about for money when the company took advantage and started using customer funds.
📊 Overall these bills and acts alongside the CBDC bill would be a significant change for the digital asset space and give much more clarity for Institutions further allowing more money to enter the space basically.
Reference:
www.coindesk.com
www.theblock.co
📊 XRP itself will be impact by these changes just like the rest of the space with some digital assets making significant jumps or declines based on what bills and changes are ultimately decided so it's a crazy week to say in the least. For Technical I've added a chart below for reference:
📊 Can see how we're facing that horizontal level of resistance at $3.10 now, gonna set an alert for that but more than anything, right now what's gonna make or break things will be the news, we've already seen how much that's done us the last few weeks, grateful and blessed for it as always.
📊 Main thing now is to keep an eye on the news and watch that $3.10 level for resistance or a further breakout. We've also converged with our 200 EMA on the 3 minute chart so no doubt we'll see bulls and bears fight to break or keep that point. Should be an interesting next few days.
📊 Have to go study but as always, grateful for the continued support and those that take the time to read through these and continue with me on this journey, it's taken a few years but things are coming together finally, grateful we've perservered.
Best regards,
~ Rock '
Weekly/monthly bullflag on xrpusdAn even higher target than the symmetrical triangles two potential targets materializes when we confirm the breakout up from this bull flag. It will likely have a bullish target somewhere around $5.20. Upon reaching this target it will also be breaking above a big cup and handle that will then have an even higher breakout target which I will post in my next idea *not financial advice*

XRP Price Action – Market Structure BreakdownThis chart illustrates a replication of XRP’s previous bullish move, with key price action and structure aligning closely with historical behavior. Here's the breakdown:
Accumulation Phase:
XRP consolidated between the $1.90–$2.20 range. This zone acted as a monthly bullish fair value gap (FVG), serving as a springboard for accumulation before the breakout.
Massive Breakout:
A large impulsive move occurred just before July 14, 2025, coinciding with the anticipated go-live of ISO 20022 standards, which many believe could support utility tokens like XRP.
Market Replication:
The breakout structure is mirroring a previous bullish cycle, highlighted by the labeled replication arrows on the left side of the chart. This pattern confirmation supports the projection of a move toward $9.99–$10, aligning with a key liquidity target and psychological round number.
Targets and Gaps:
Price is shown aggressively pushing through bearish FVGs and reaching above previous highs, suggesting that liquidity above $10 could be the next target. The $9.99 level is marked as a clear draw on liquidity.

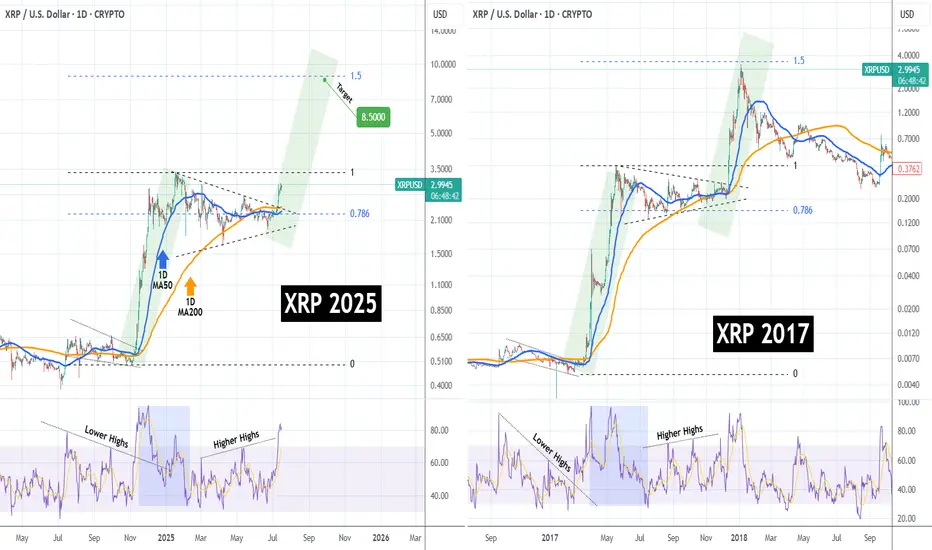
XRPUSD Has it started the mega rally to $8.500??XRP (XRPUSD) has been trading within a Triangle pattern for the past 6 months (January - July 2025) and only recently, it broke to the upside. Ahead of a pending 1D Golden Cross, this pattern is no different than the one of the previous Cycle from May - December 2017.
That setup resulted into the final Parabolic Rally of the Cycle that peaked just below the 1.5 Fibonacci extension. As you can see, both fractals are identical even from their starts, both initiated after a Falling Wedge that produced the first Parabolic Rally (green), which transitioned into the Triangle we described. Even their 1D RSI sequences are similar.
As a result, it is more than probable to see XRP hit $8.500 (Fib 1.5 ext), by the end of the year.
-------------------------------------------------------------------------------
** Please LIKE 👍, FOLLOW ✅, SHARE 🙌 and COMMENT ✍ if you enjoy this idea! Also share your ideas and charts in the comments section below! This is best way to keep it relevant, support us, keep the content here free and allow the idea to reach as many people as possible. **
-------------------------------------------------------------------------------
💸💸💸💸💸💸
👇 👇 👇 👇 👇 👇
Birthday Month&All I Want Is for XRP Retest Those Previous HighRight now, XRP is sitting at $2.99. But once it reclaims and surpasses that $3.84 level, we’ll officially be in uncharted territory. Some people say XRP is going to $100... others say $525... and there are even calls for $10K.
All I know is this: once XRP prints a true higher high, the chart’s going parabolic. And I truly believe a lot of the Bitcoin maxis who clowned on XRP are going to be eating their words.
We’ve waited, we've studied, and we've held through the chaos.
So on my birthday, I’m not asking for much — just a retest of that all-time high, and a chance to ride the wave that’s been building for years.
📈 Let’s make history.


XRP Cools Near $3.00 Amid Overbought SignalsFenzoFx—XRP remains bullish after piercing $3.00 earlier this week but cooled near resistance. Trading around $2.90, Stochastic (~84) and RSI 14 (80) indicate overbought conditions, suggesting consolidation.
We anticipate a pullback toward $2.66 support before resuming the uptrend. Alternatively, a decisive break above $3.00 would target $3.21 next.


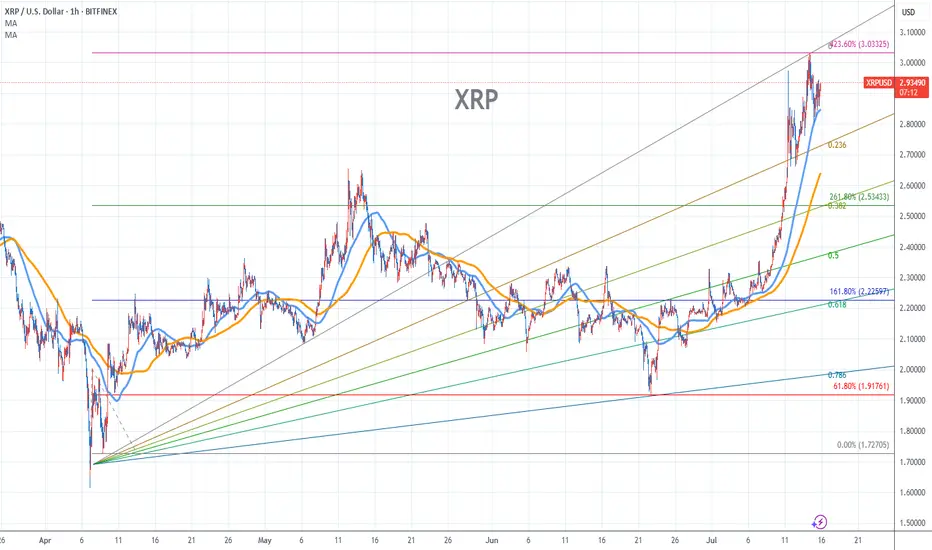
XRP Stock Chart Fibonacci Analysis 071525Trading idea - Hit the top - 3.03/423.60%
Chart time frame:B
A) 15 min(1W-3M)
B) 1 hr(3M-6M)
C) 4 hr(6M-1year)
D) 1 day(1-3years)
Stock progress:E
A) Keep rising over 61.80% resistance
B) 61.80% resistance
C) 61.80% support
D) Hit the bottom
E) Hit the top
Stocks rise as they rise from support and fall from resistance. Our goal is to find a low support point and enter. It can be referred to as buying at the pullback point. The pullback point can be found with a Fibonacci extension of 61.80%. This is a step to find entry level. 1) Find a triangle (Fibonacci Speed Fan Line) that connects the high (resistance) and low (support) points of the stock in progress, where it is continuously expressed as a Slingshot, 2) and create a Fibonacci extension level for the first rising wave from the start point of slingshot pattern.
When the current price goes over 61.80% level , that can be a good entry point, especially if the SMA 100 and 200 curves are gathered together at 61.80%, it is a very good entry point.
As a great help, tradingview provides these Fibonacci speed fan lines and extension levels with ease. So if you use the Fibonacci fan line, the extension level, and the SMA 100/200 curve well, you can find an entry point for the stock market. At least you have to enter at this low point to avoid trading failure, and if you are skilled at entering this low point, with fibonacci6180 technique, your reading skill to chart will be greatly improved.
If you want to do day trading, please set the time frame to 5 minutes or 15 minutes, and you will see many of the low point of rising stocks.
If want to prefer long term range trading, you can set the time frame to 1 hr or 1 day.