iExecRLC | This Is What I See Long-Term (Simplicity)This is a long-term chart.
This is what I see happening in the long-run.
We can easily appreciate the cycles on this chart.
Simply a wave up, a wave down; wave up, wave down...
At the same time we have Higher Highs (HH) and Higher Lows (HL).
We are in a down wave, the next wave should be up.
Namaste.
RLCBTC trade ideas

RLC/BTC Breakout Bull flag channel so 200% Potential now#RLC/BTC
#RLC broke out Bull flag channel resistance .
So I am expecting 200% Minimum from here.
Entry:- 7000-7600 Satoshi
Targets:- 10800/14700/21000 Satoshi
Stop Loss:- 6300 Satoshi
Support:- 6700 Satoshi
Resistance:- 10800/14700/21000 Sat

RLCBTC Looks BullishThis is another Altcoin pair that we've been tracking recently.
We can see already some strong bullish action but there can be more above the MA200 black line.
There will be resistance at this level (0.00007750) but we believe that the entire market will go up.
We are of the patience type so we look to buy and hold.
This one is very likely to do good in 2022...
This is not financial advice of course.
I will be sharing a few more Altcoins that we've been holding since 2021 and now are preparing for a breakout...
Remember that the markets are always changing, you need a plan to trade.
This is not risk free.
Sometimes we win.
Sometimes we lose...
But when we win we win big.
When we lose we lose small.
Thanks a lot for your support.
Namaste.

$RLC, The entire Alt market is bullish, and this will follow$RLC
2D flashing a buy // 1D bullish for a week now..
The entire Alt market is bullish, and this will follow
#RLC

(350%+ Potential) RLCBTC Trade SignalPair: RLCBTC
ENTRY: 0.00005650 - 0.00006150
TP0: 0.00007040
TP1: 0.00009500
TP2: 0.00010400
TP3: 0.00011500
TP4: 0.00012800
TP5: 0.00014800
TP6: 0.00016800
TP7: 0.00020100
TP8: 0.00025410
TP9: 0.00028650
STOP: Close Weekly (W) below 0.00005400.
--------
Enjoy.
Remember to be patient and have a plan before you trade.
This is not financial advice.

iExecRLC Next Bullish Jump!After the strong jump 3-Dec. RLCBTC went straight down, we are waiting for a new jump.
When people become excited and buy into a pair they do this without a plan.
Market manipulators can see this and what follows the price increase is a huge crash.
When the people get desperate and sell at a low (around mid-Dec.), that's when everything recovers and a new wave shows up.
We are expecting higher prices soon for this pair.
We wait patiently.
See the details on the chart.
Namaste.

$RLC/BTC 2D (Binance Spot) Descending wedge breakoutiExec RLC just regained 100EMA support and looks good for bullish continuation from here.
That DeFi token is focused on Privacy and AiBigData, they are about to launch their own NFT marketplace, more info on iex.ec
Current Price= 0.00008212
Buy Entry= 0.00008234 - 0.00007392
Take Profit= 0.00011137 | 0.00015939 | 0.00020573
Stop Loss= 0.00006147
Risk/Reward= 1:2 | 1:4.88| 1:7.66
Expected Profit= +42.54% | +104.01% | +163.32%
Possible Loss= -21.32%
Fib. Retracement= 0.382 | 0.618 | 0.786
Margin Leverage= 1x
Estimated Gain-time= 4.5 months

iExecRLC | Booming With More To Come (222% Mapped)Look what I just bought this morning...
RLCBTC (iExecRLC) is another Altcoin that we have been trading for many years.
I can remember bullish waves lasting for long and going higher and higher and higher... I am making sure to be on it this time around.
Easy to see, RLCBTC has gone above EMA100 and EMA300.
It is challenging MA200 (black line) now.
Closing above MA200 (0.00008778) can push prices upward fast, this is what we are looking for.
This is a beautiful chart.
I am mapping 222% potential for profits but there can always be more.
I am being conservative just because but all pairs are very likely to go higher than whatever number we type on these charts...
Don't believe me? Look at GXChain (GXSBTC) -Related trade ideas below... That's how everything else will go.
Thanks again.
Wishing you a lovely weekend.
Sending you positive vibe.
Sending you money energy.
Giving you the charts like nobody has ever done it before.
Namaste.

Significant volumeTarget hit in the previous analysis in very short time, lets see if the history repeats...


RLC / BTC Secondary trend. Double bottom.The local downtrend breaks down. A double bottom is formed with a base of about 100%.
With a high degree of probability, the pumping will be an order of magnitude more than the previous one, provided the altseason continues.
This coin in coinmarketcap: iExec RLC
This coin is not a scam. The real work is done with very well-known brands of the "material world". If all the cards are revealed, then the price with a stream of news without FUD tales can be made by anyone. Dark Horse Coin as DOGE. I did not place this coin in group 2 according to my rating, as there are doubts about its "survival" in the long term due to competition in similar industries from the side of "material hegemons"
Past trading ideas for this coin and the result
RLC/BTC. Downward price channel. Bull Bat. Double bottom. Pump
+474%
RLC / BTC Falling Wedge. Local work
+357%

RLCBTC 1D long setup; Bounce off support zone and above EMAsTA explained
RLC consolidated above the 1D EMAs and support zone . Ready for the pullback move of the downtrend at least.
Trade setup
Best entries: 0.00008212 - 0.00009150
TP1: 0.00010633
TP2: 0.00012306
TP3: 0.00014146
SL: 0.00007470
RR: 4.36
Max leverage: na
—————
MDSquared Crypto Lounge
—————
Do Your Own Research (of course)
Trade at own risk (of course)
Only trade what you can afford to lose (of course)

RLC/USDT { IEXECRLC } - BULLISH SETUPANALYSIS 🔎
- RLC/BTC is printing an ascending triangle pattern.
- This is a bullish build up pattern.
- There's a breakout potential.
BUY ENTRY ⬆️
- Market entry: current market price.
- Stop limit entry: breakout above the ascending triangle's horizontal resistance (@0.00009289)
- Limit entry: test of the ascending triangle's inclined support.
TARGETS 🎯
- Fibonacci extension levels.
SETUP INVALIDATION ❌
- Breakdown below the ascending triangle's inclined support.


RLC BULLISH SETUP RLC violated its resistance with great volume.
RLC has now bounced on its old channel 👇🏻 (previously)

iExec RLC: Bullish on the weekly time frame in pair with bitcoiniExec RLC is ranging in a falling wedge. Once it breaks out of the wedge it can go high as %520 following the parabola

RLC at critical support and has a chance of breakoutThe price action and MACD are both tapering. RSI looks close to oversold.
OBV does not seem to show lot of selling even when the price action has been downward.
Expecting this to breakout in the coming weeks. This is a project with good fundamentals and will compete directly with the
centralized cloud compute providers. The market cap is still under $1 billion while its competitors are orders of magnitude larger than it.
It will also compete with Chainlink on oracles.
Minimum marketcap target is over $10billion.
Note: This is not financial advise. Please do your own research.

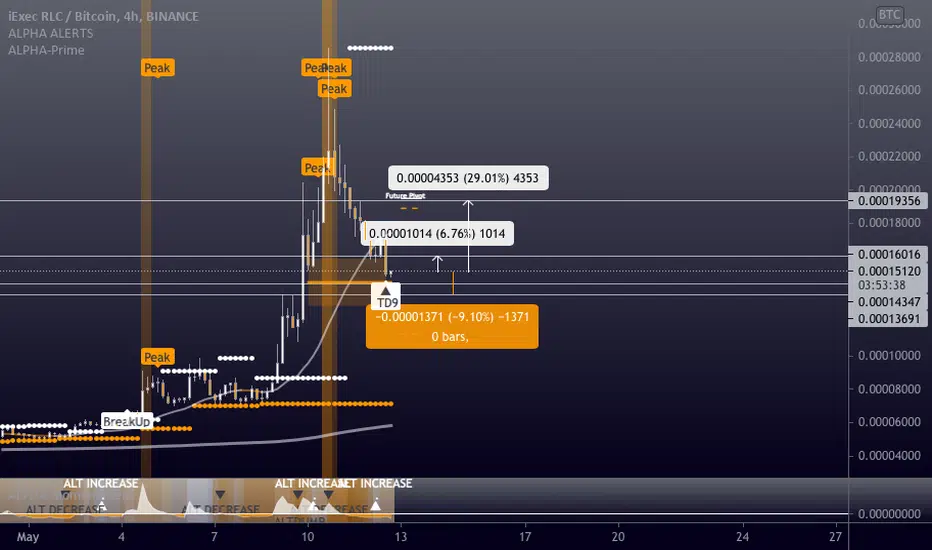
RLCBTC - Long - Potential 29.01%RLCBTC - Long - Potential 29.01%
Exchanges: Binance
Signal Type: Regular (Long)
Entry Zone:
0.00014347 - 0.00015090
Take-Profit Targets:
1) 0.00016016
2) 0.00019356
Stop Targets:
1) 0.00013691
Trailing Configuration:
Entry: Percentage (0.0%)
IEXEC RLC / BITCOIN - Long Term TrendA great project with strong fundamentals and the potential to provide decent BTC ratio gains during the start of the altcoin cycle
Fundamentals:
Promising project with a technically knowledgable team, decentralized Oracles (look at what happened in price action compared to LINK), Cloud Computing for graphic 3d rendering and AI (machine learning models), etc.
Enterprise Marketplace Launch Q1
Collaboration and research with large industry players in the tech sector
Total Supply = 86,999,785 RLC
Circulating Supply = 80,070,793 RLC
Technicals:
Weekly MACD histogram showing bullish flip on the weekly chart
Parabolic SAR indicates a start to a potentially strong uptrend on the daily chart
Price broke out of the long-term bullish descending wedge and formed a medium-term bullish descending wedge
Price forming Ascending triangle on 4h chart
Long-term Gann line acting as support should the ratio drop
EMA Cross on daily (20 EMA ready to cross above 50 EMA)
Fractal points to a future price increase up to at least red horizontal or orange resistance lines
Targets for RLC/BTC
TP1 = +-0.00021
TP2 = +-0.00026
TP3 = +-0.00039
TP4 = +-0.00057


RLCBTC Until we break macro down-trend still in bear :DiExec has had amazing gains last days. Current resistance is a macro down-trend. If we break these levels, RLCBTC gets even more bullish. But this seems to be a logical place to cool down and consolidate before breaking to the upside.

Crypto|RLC/BTC|LongLong RLC/BTC
Activation of the transaction only when the blue zone is fixed/broken.
The author recommends the use of anchoring fixed the blue zone, this variation is less risky.
If there is increased volatility in the market and the price is held for more than 2-3 minutes behind the activation zone after the breakdown, then the activation of the idea occurs at the prices behind the activation zone.
The idea is to work out the resistance level .
* Possible closing of a trade before reaching the take/stop zone. The author can close the deal for subjective reasons, this does not completely cancel the idea and is not a call to the same action, you can continue working out the idea according to your data, but without the support of the author.
+ Maybe right now we will go even lower, then it's okay, the idea is not activated and simply canceled.
+ ! - zone highlighted by the ellipse is a zone of increased resistance, in this area there is a possible reversal for a correction, please take this factor into account in this transaction.
The "forecast" tool is used for more noticeable display of % (for the place of the usual % scale) of the price change, I do not put the date and time of the transaction, only %.
Blue zones - activation zones.
Green zones - take zones.
The red zone - stop zone.
Working out the stop when the price returns to the level after activation + fixing in the red zone.
Orange arrow - the direction of take.
Blue arrow - neutral scenario without activating the trade.
The red arrow - the direction of the stop.
SUM PNL: This parameter displays the total % of all closed ideas of the "new" format (according to the author) for this sector at the time of publication of the idea. The calculation is very "clumsy" just the sum of the profits of all the ideas, based on this indicator, you can more accurately assess the risks when working with my ideas of this sector. I present you the construction of the idea, you can use it yourself as you like based on your subjective view and risks, the calculation of the PNL indicator is carried out only on transactions that the author closed on TV in manual mode or by take.
P.S Please use RM (risk management) and MM (money management) if you decide to use my ideas, there will always be unprofitable ideas, this will definitely happen, the goal of the system is that there will be more profitable ideas at a distance.

