#RLC/USDT#RLC
The price is moving within a descending channel on the 1-hour frame, adhering well to it, and is heading toward a strong breakout and retest.
We are experiencing a rebound from the lower boundary of the descending channel, which is support at 0.995.
We are experiencing a downtrend on the RSI indicator, which is about to break and retest, supporting the upward trend.
We are heading toward stability above the 100 Moving Average.
Entry price: 1.028
First target: 1.063
Second target: 1.102
Third target: 1.152
RLCUSDT trade ideas

#RLC/USDT Pump Anticipated#RLC
The price is moving within a descending channel on the 1-hour frame, adhering well to it, and is on its way to breaking strongly upwards and retesting it.
We have support from the lower boundary of the descending channel, at 1.155.
We have a downtrend on the RSI indicator that is about to be broken and retested, supporting the upside.
There is a major support area in green at 1.143, which represents a strong basis for the upside.
Don't forget a simple thing: ease and capital.
When you reach the first target, save some money and then change your stop-loss order to an entry order.
For inquiries, please leave a comment.
We have a trend to hold above the 100 Moving Average.
Entry price: 1.170.
First target: 1.200.
Second target: 1.234.
Third target: 1.282.
Don't forget a simple thing: ease and capital.
When you reach your first target, save some money and then change your stop-loss order to an entry order.
For inquiries, please leave a comment.
Thank you.

#RLCUSDT #1D (Binance Futures) Descending wedge on supportiExec RLC just printed a dragonfly doji which may have marked the bottom on daily.
A morning star is drawing now, recovery towards 100EMA resistance seems around the corner.
⚡️⚡️ #RLC/USDT ⚡️⚡️
Exchanges: Binance Futures
Signal Type: Regular (Long)
Leverage: Isolated (4.0X)
Amount: 5.9%
Current Price:
0.9126
Entry Targets:
1) 0.9002
Take-Profit Targets:
1) 1.1854
Stop Targets:
1) 0.7859
Published By: @Zblaba
GETTEX:RLC BINANCE:RLCUSDT.P #DePIN #AI #iExec iex.ec
Risk/Reward= 1:2.5
Expected Profit= +126.7%
Possible Loss= -50.8%
Estimated Gaintime= 1 month

RLCUSDT 1W AnalysisRLC ~ 1W Analysis
#RLC This is the closest support for now. Buy if you still have faith in this coin with a short-term target of at least 20%++

RLC Update 1D I believe we can See a solid project with a shared focus between DePIN and AI that meets strong technical criteria. Given the current favorable market conditions, I think it has the potential for significant growth.

#RLC/USDT#RLC
The price is moving in a descending channel on the 1-hour frame and is adhering to it well and is heading to break it upwards strongly and retest it
We have a bounce from the lower limit of the descending channel, this support is at a price of 1.13
We have a downtrend on the RSI indicator that is about to be broken and retested, which supports the rise
We have a trend to stabilize above the moving average 100
Entry price 1.15
First target 1.17
Second target 1.20
Third target 1.25

RLCUSDT 1D Analysis RLC ~ 1D Analysis
#RLC Buy on retesting this support block or buy after successfully breaking this resistance line with a short term target of at least 10%+.

RLCUSDT Pump Anticipated**📊 Entry:** Check the chart for optimal entry points.
**🎯 Targets:** 1.86 - 2.06 - 2.32 (51% potential move in spot).
**🛑 Stop-loss:** 1.280 – Stick to this level to manage risk.
💡 Remember to manage your position size carefully, keep an eye on market conditions, and don’t chase the trade if you miss the entry.

RLC Risky Long Idea (Snipe)Here will try to go with a Snipe Entry on RLCusdt Pair if it gives me that price.
I believe if the entry area holds we are going to see a quick pump towards next levels.
Highly Risky Trade.
Strategy
Have leveraged entries set at 1.3750 and under.
with stops flat at 1.3580.
Note: Not a Financial Advice
DYOR

RLC up?As we got our favorite FBuy print and volume up and a news from RLC, let's see where this pump end up. stop loss below 1.3 DYOR
for indicator access you can drop a message.

iExec RLC (RLC/USDT) - Key Levels To Watch 1HRLC is showing strong bullish momentum, currently trading around $1.34, with a potential breakout on the horizon.
A breakout above resistance with strong volume could lead to an explosive move!
Keep an eye on price action and confirmation signals.

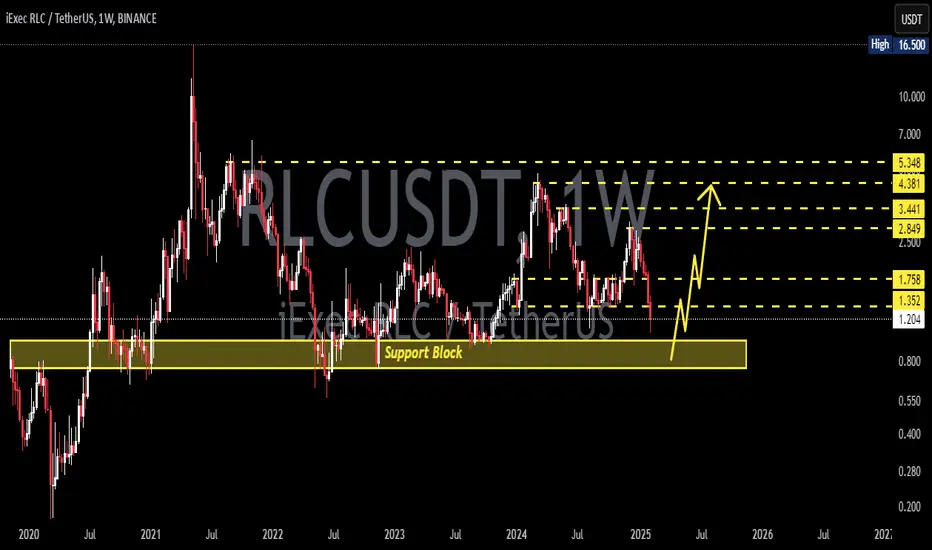
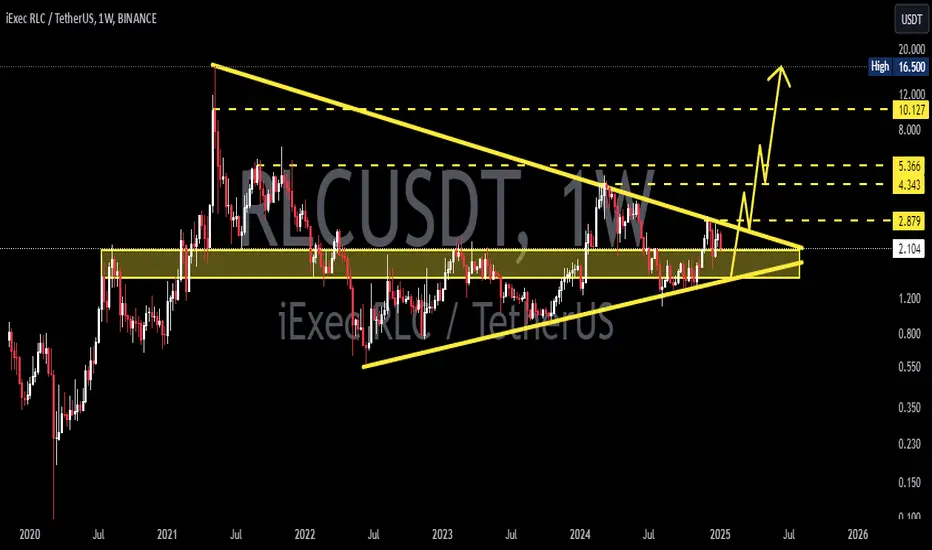
RLC big picture planThe rising trendline over the last 5 years is the only thing that makes me still want to hold this coin. Therefore, in my opinion there is nothing that makes me believe we will go lower than current levels. As far as upside, I do believe sky is the limit. Let's observe how this evolves over the next few months.
Cheers!

RLC SHORT !!!!#RLC/USDT
Entry zone : 1.3650 - 1.3306
Targets : 1.3186 - 1.2919 - 1.2653 - 1.2386 - 1.2120 - 1.1854 - 1.1587 - 1.1321
Stoploss :1.41

$RLC Looking for SHORT In the weekly timeframe, it seems that the price has broken its upward trendline.
But I'll wait for the pullback.
On the other hand, the price might also reach the upper drawn trendline, which could be a good point for a sell.

RLCUSDT 1WRLC ~ 1W Analysis
#RLC This support block continues to be maintained so far. Buy from here with a minimum target of 20%+.
#RLC/USDT#RLC
The price is moving in a descending channel on the 1-hour frame and is expected to continue upwards
We have a trend to stabilize above the moving average 100 again
We have a descending trend on the RSI indicator that supports the rise by breaking it upwards
We have a support area at the lower limit of the channel at a price of 1.98
Entry price 2.08
First target 2.19
Second target 2.28
Third target 2.38

RLCUSDT 1WRLC ~ 1W
#RLC If you still have Conviction on this coin,. Maybe this support block is a good time to start buying back.
RLC expecting HTF breakoutI am long on this expecting for a huge breakout sooner.
Super clean cup and handle on daily.
A good position for long entry under 2.5.
I think it Won't go any lower if stays here for a bit.
Note: Not a Financial Advise.

RLCRLC/USDT Technical Analysis 📈
This chart presents a clean and structured technical analysis for the RLC/USDT pair on the 1D timeframe. Key focus has been placed on identifying critical support and resistance levels, along with potential trend developments.
✅ Key Levels:
Resistance zones: $3.07 and $3.70
Support zones: $2.21 and $1.79
✅ Trend Insights:
The chart highlights a possible "Cup and Handle" formation, suggesting a potential bullish breakout in the mid-to-long term.
Downward trendlines are currently exerting pressure, but a breakout above these lines could signal the start of a new bullish trend.
🎯 Objective:
This analysis focuses on maintaining clarity and emphasizing key market zones to assist in making informed trading decisions.
What’s your perspective on this setup? Share your thoughts below! 👇
#TradingView #RLCUSDT #CryptoTrading #TechnicalAnalysis

Key Moment for RLC: Breakout Opportunity or Bearish Threat?Yello, Paradisers! Is #RLCUSDT setting up for a powerful bullish continuation, or are we facing a bearish rejection? Let’s dive into the key levels you need to watch right now.
💎#RLC has made a strong rebound off its support, showing promising signs of strength. A successful breakout from the falling wedge pattern could confirm a bullish continuation. For this, we need a daily close above the trendline to validate the breakout. If this happens, the next target would likely be the minor resistance at $2.67. This level is crucial because a breakout here could lead to the highest probability of reaching the major resistance level.
💎If RLC fails to break the falling wedge and faces rejection with bearish candles, the price might drop back to retest the support zone around $1.87–$1.72.
💎The real concern arises if RLC fails to rebound from this support and breaks below it. In this case, the price would likely continue its downward trajectory toward the strong support at $1.30.
💎The $1.30 level represents the last line of defense for the bullish scenario. A rebound from here, followed by a reclaim of the $1.87 support, is necessary to reignite bullish momentum.
💎However, if RLC breaks below the major support at $1.30 and a daily candle closes under this level, it would confirm a bearish trend, with the potential for further downside and deeper dips.
Strive for consistency, Paradisers, and trade smart. This market rewards the disciplined and punishes the impulsive. Let’s stay focused and make the best decisions possible.
MyCryptoParadise
iFeel the success🌴

RLC about to Begin AgainLoaded some RLCusdt in spot.
This is going to start again and go for highs soon when it holds the current area.
Sharp Pump Days Ahead.
Invalidation clean breaking below 2.4
Note: Not a Financial Advise.

RLC technical analysisnice up trend + nice support + nice coin + bullrun = GAINs BABY <3
target at : 2.62 (7%) / 2.78(12%) / 2.92 (18%)
any breakout above 3.1% = higher target with more profits.
stop loss ? i didn't set any stoploss , especially in december when market manipulations are frequent , it might drop a little , but i trust the coin and my analysis
but feel free to put your stop loss bellow the blue trend with 1daily close candle.
enjoy.
BINANCE:RLCUSDT COINBASE:RLCUSD
